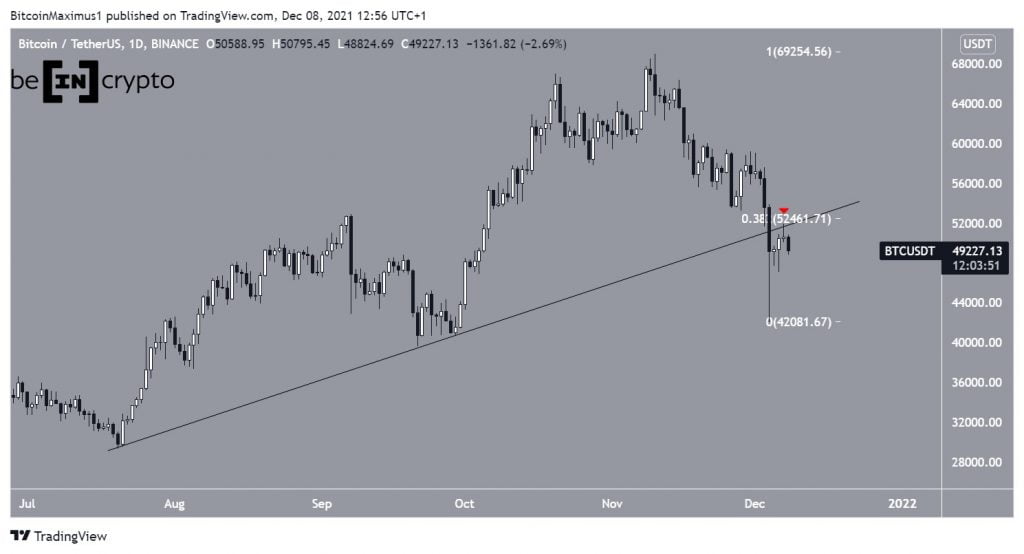
BTC
Bitcoin (BTC) had been following an ascending support line since the beginning of July. On Dec 4, it broke down from the loine and proceeded to reach a low of $42,000.
However, it bounced shortly afterwards and validated the line as resistance (red icon). The line also coincides with the 0.382 Fib retracement resistance level at $52,450.
Until it manages to reclaim it, the trend cannot be considered bullish.
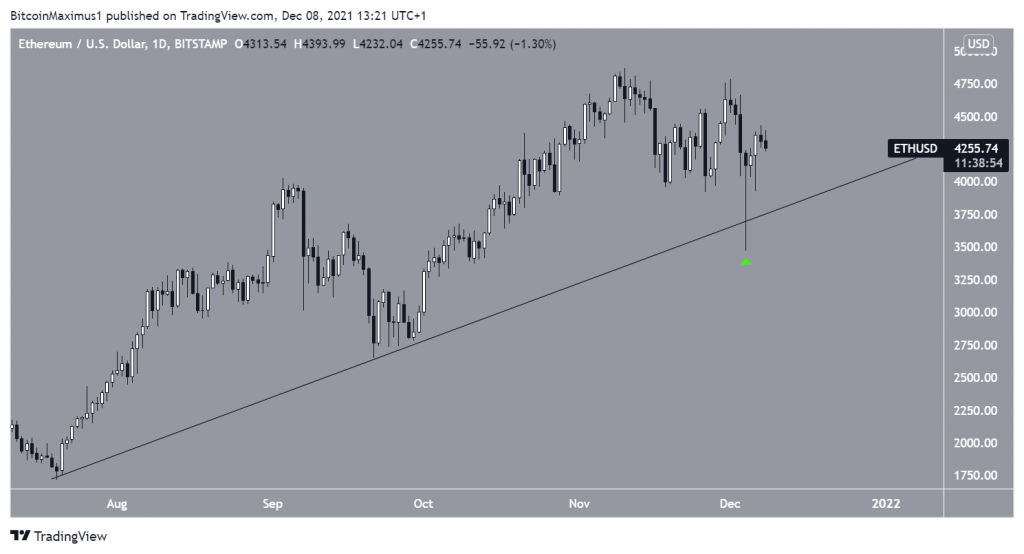
ETH
Unlike BTC, Ethereum (ETH) is still following its ascending support line. The Dec 4 fall only caused a validation of this line and created a long lower wick (green icon). This is considered a sign of buying pressure.
Therefore, the price movement of ETH is more bullish than that of BTC and could eventually move towards a new all-time high price.
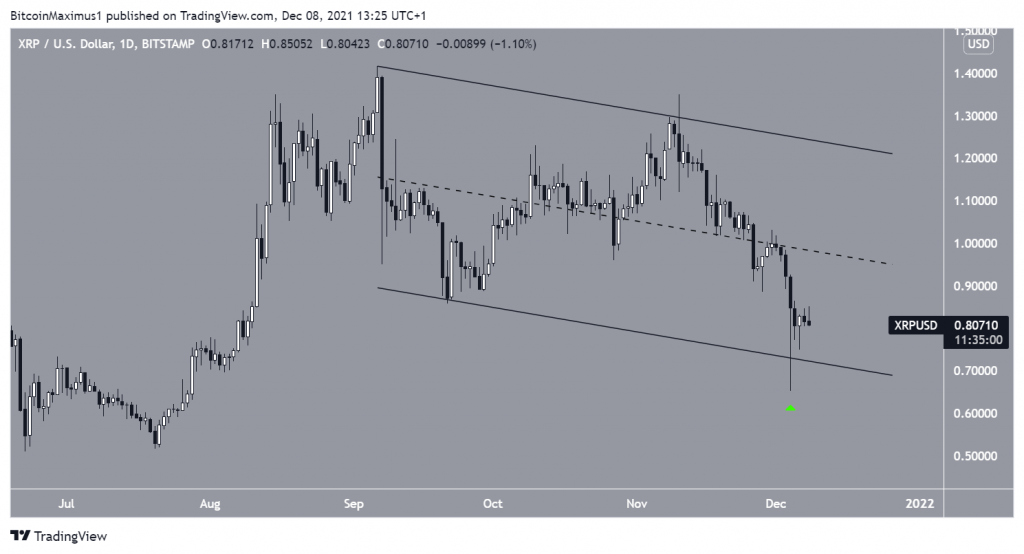
XRP
XRP (XRP) has been decreasing since Sept 5. However, the movement was contained inside a descending parallel channel. This is considered a corrective pattern, meaning that a breakout would be expected the majority of the time.
On Dec 4, XRP bounced above the support line of the channel.
While it has yet to initiate a considerable upward movement, the bullish structure remains intact as long as XRP is trading inside this channel.
AXS
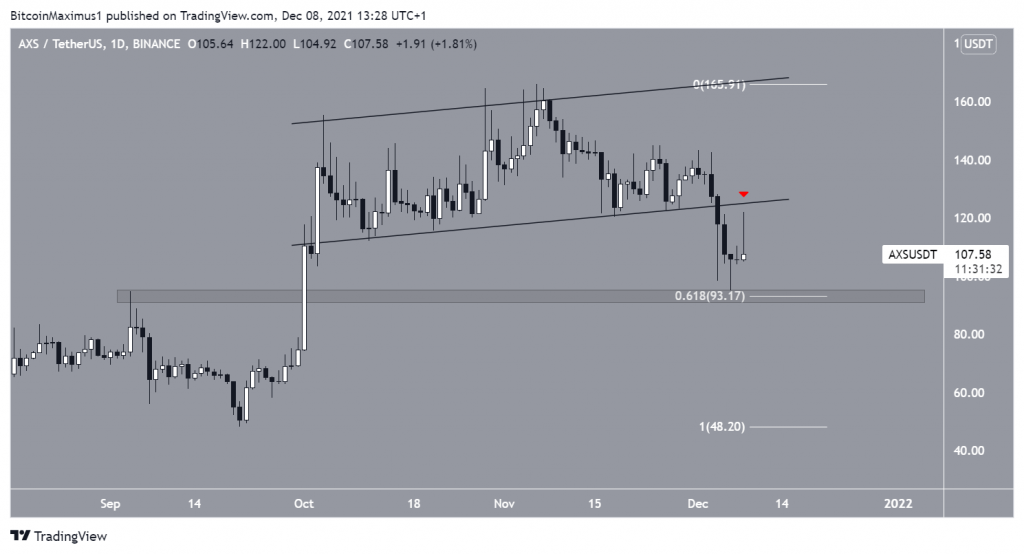
Axie Infinity (AXS) had been trading inside an ascending parallel channel since Oct 4. However, it broke down from it on Dec 4 and validated it as resistance (red icon) four days later.
However, AXS bounced once it reached the $93.15 support, which is both a horizontal support area and the 0.618 Fib retracement support level.
As long as it is trading above this level, the possibility of a short-term bounce remains.
XTZ
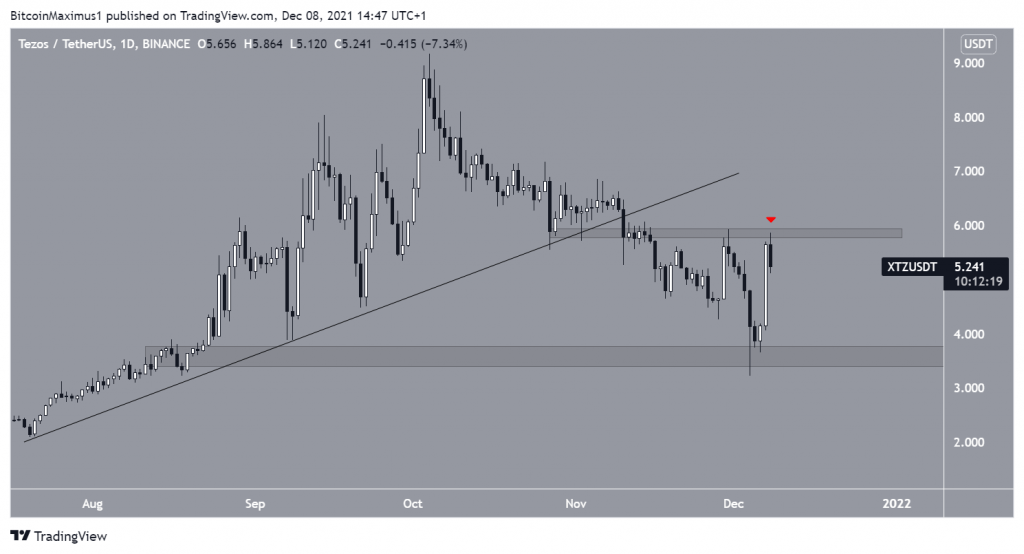
Tezos (XTZ) has been falling since Oct 4, when it reached an all-time high price of $9.17. The downward movement has so far led to a low of $3.22, which was reached on Dec 4.
During the decrease, XTZ broke down from an ascending support line.
However, it bounced on Dec 4 and validated the $3.80 area as support. Currently, it is attempting to move above the $6.05 resistance area (red icon). Doing so could accelerate the rate of increase.
EOS
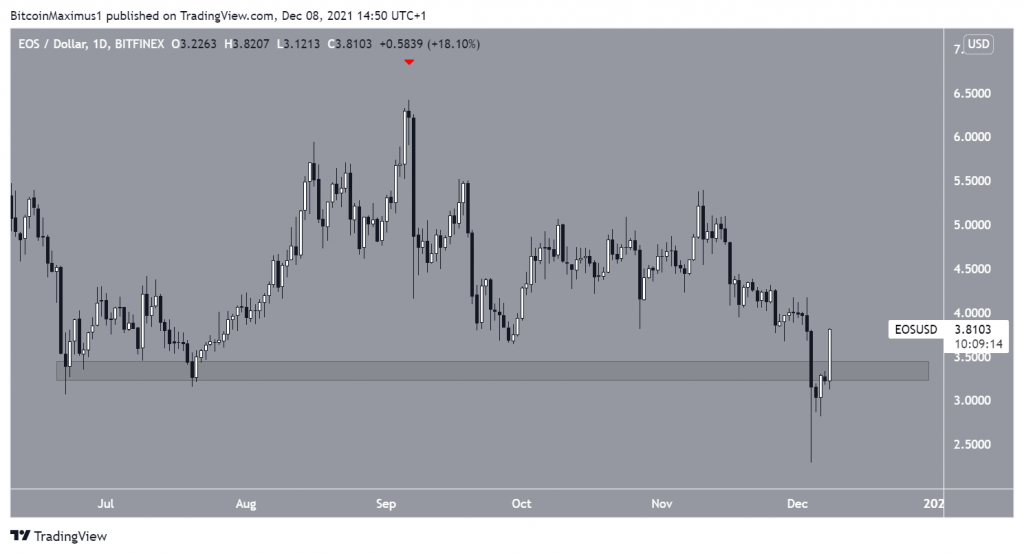
EOS (EOS) has been falling since Sept 6. Initially, the downward movement was halted close to the $3.30 hoirzontal area. However, EOS broke down on Dec 4.
However, EOS has reclaimed the area since. Is successful in holding above it, it would render the previous decrease as only a deviation.
This would be a bullish development that often leads to bullish trend reversals.
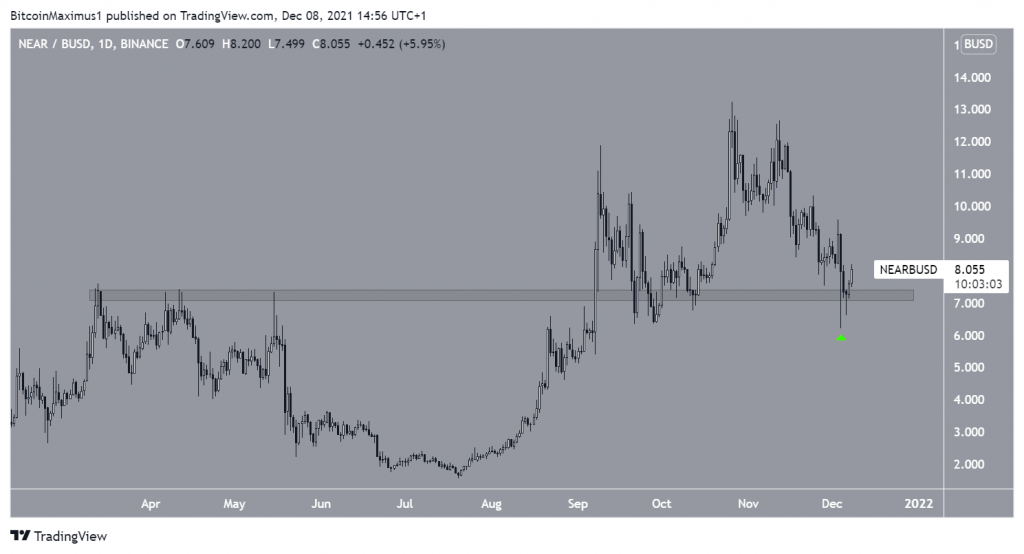
NEAR
Near Protocol (NEAR) has been falling since Oct 26, when it reached an all-time high price of $13.22. The decrease led to a low of $6.20 on Dec 4.
However, the token bounced afterwards and validated the $7.20 area as support. This is a crucial level, since it previously acted as the all-time high resistance.
As long as NEAR is trading above it, the trend can still be considered bullish.