


The ETH/ BTC chart shows the coin price has been trapped in a consolation period for more than six month now. However, looking at the bigger picture, the coin displays a strong bullish pattern in play, which could bring significant bullish momentum to this coin. Watch for these important levels for ETH.
- The ETH coin price action forms a Cup and Handle pattern
- The ETH coin forms an inverted head and shoulder pattern in the 4-hour time frame chart.
- The intraday trading volume in the ETH coin is $16.3 Billion, indicating a 32.5% loss.

Source- ETH/BTC chart by Tradingview
The ETH technical chart presents a Cup and Handle pattern in the daily time frame chart. The pattern has its neckline(resistance zone) at 0.086 BTC-0.0825 BTC. However, the coin price is still busy forming the handle portion of this pattern.
Once the ETH price gives a decisive breakout from the overhead resistance, the crypto traders could grab an excellent long opportunity in this coin. As with the completion of this pattern, the ETH price could surge to 0.123 BTC.
The crucial EMAs(20, 50, 100, and 200) show the bullish alignment for the ETH coin. The Relative Strength Index value at 58 indicates the coin maintains a positive sentiment among the market participants. However, the RSI chart bearish divergence in its chart suggests to keep your guard up.
ETH/BTC Chart In The 4-hour Time Frame
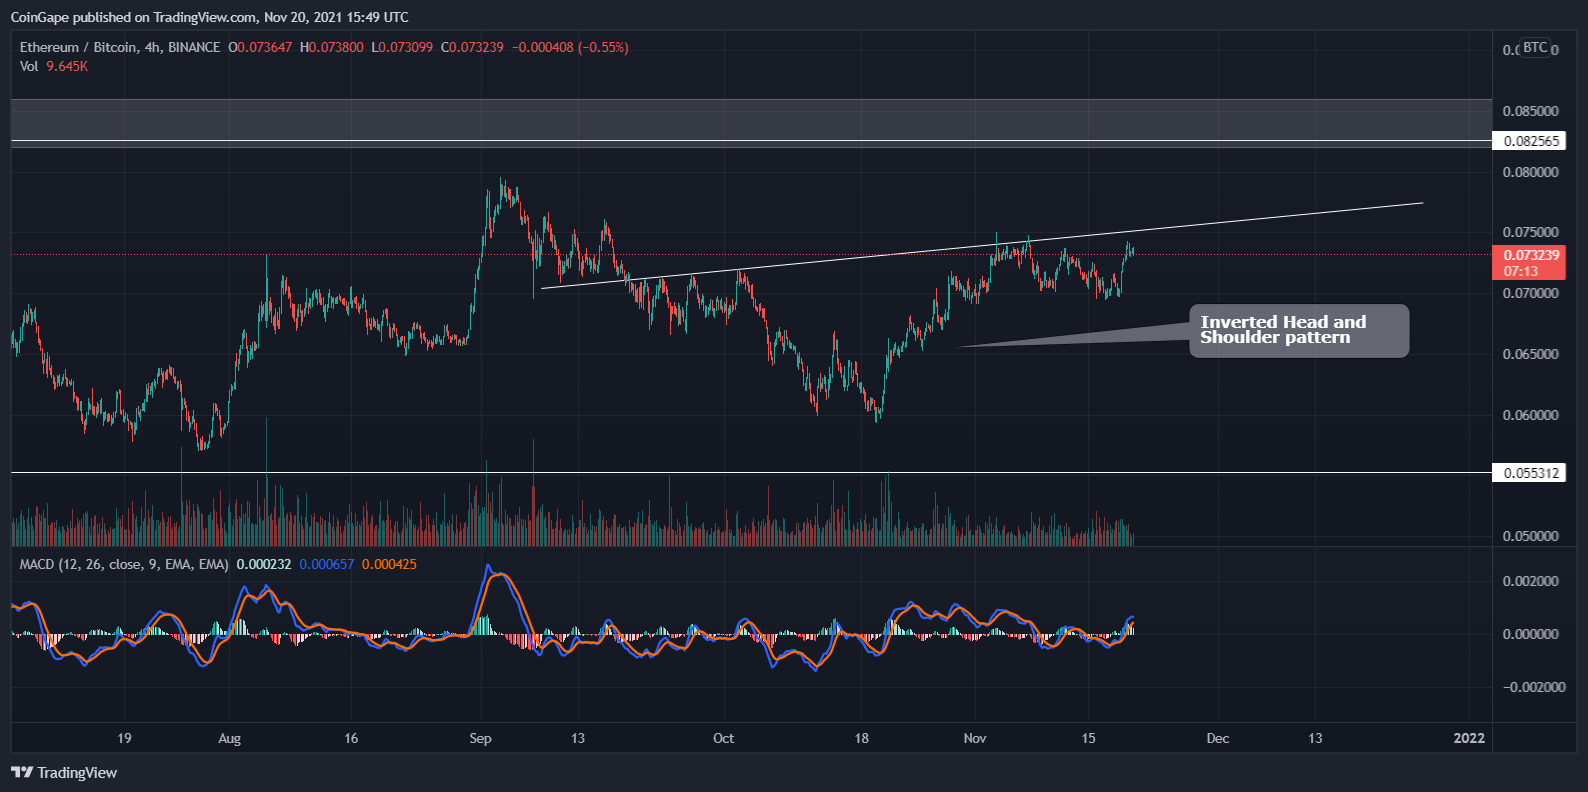
Source- ETH/BTC chart by Tradingview
The remarkable rally of ETH coin faced strong resistance from the 0.83 BTC level on March 15th, and since then, the price has kept resonating in a short-range, stretching from 0.55 BTC to 0.825 BTC.
Moreover, the chart reveals another bullish pattern in this lower time frame, i.e., an inverted head and shoulder pattern. This bullish pattern can provide enough boost to the coin price and help it rechallenge the crucial resistance of 0.825 BTC for a bullish breakout.