Fight to Maintain Momentum")
Technical indicators for Cardano (ADA) provide a bearish outlook. Unless the $2.33 area is reclaimed, the trend cannot be considered bullish.
ADA has been falling since reaching an all-time high of $3.1 on Sept 2. So far, it has dropped to a low of $1.91, doing so on Sept 21.
While the token has moved slightly upwards since, it is still trading below the $2.33 resistance area. This area is crucial, since it previously acted as the all-time high resistance in May.
After the Aug breakout, the area was expected to act as support. However, it did not do that, since ADA broke down below it.
Technical indicators are also bearish.
The MACD, which is created by a short- and a long-term moving average (MA), is negative and decreasing. This means that the short-term trend is slower than the long-term one.
The RSI, which is a momentum indicator, is below 50. This is also a sign of a bearish trend.
Finally, the Supertrend is bearish (red line). The indicator is created by using absolute high and low prices. Since ADA is below it, the trend is considered bearish.
The previous time the line was bearish, a roughly two months decrease transpired, in which ADA decreased from $2.5 to $1.
Therefore, unless ADA manages to reclaim this area, the trend cannot be considered bullish.

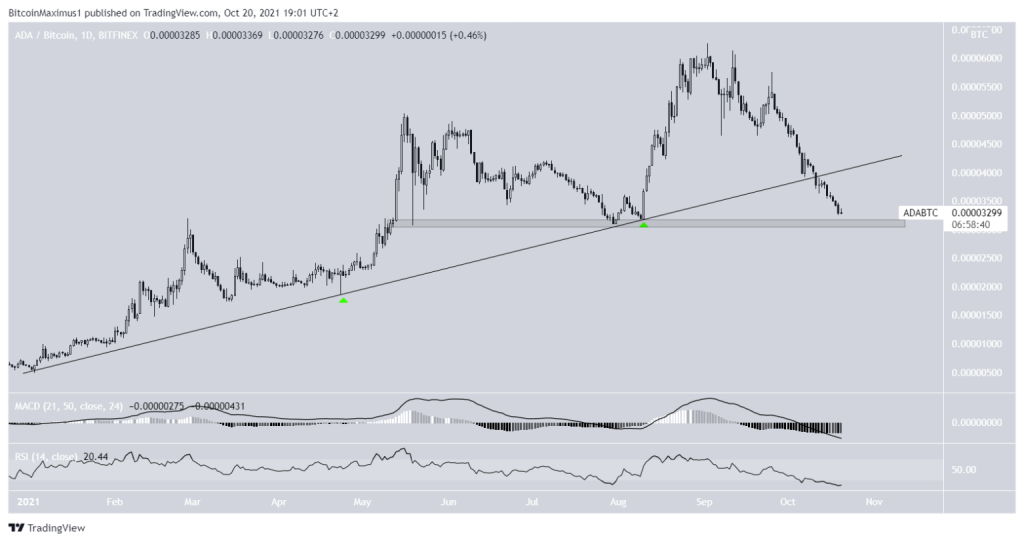
ADA/BTC
Cryptocurrency trader @CryptoCapo_ outlined an ADA/BTC chart, stating that the token is likely to decrease towards 3100 satoshis.
The ADA/BTC pair is more bullish than its USD counterpart.
The token has broken down from an ascending support line that has been in place since 2021. Previously, the line initiated two bounces (green icons).
The fact that the line had been in place for the entirety of the upward movement and has now been broken is a very bearish development.
Furthermore, the MACD and RSI provide bearish readings similar to the USD pair. The MACD is bearish and decreasing, while the RSI has fallen below 30. The latter shows even worse momentum than the RSI for ADA/USD, which has just fallen below 50.
The closest support area is at 3,100 satoshis.