


Bitcoin is struggling to recover above $57,500 against the US Dollar. BTC is declining and could accelerate lower below $55,000 in the near term.
- Bitcoin is facing resistance near the key $58,000 and $57,500 levels.
- The price is now trading below $57,500 and the 100 hourly simple moving average.
- There is a crucial bearish trend line forming with resistance near $57,300 on the hourly chart of the BTC/USD pair (data feed from Kraken).
- The pair is under pressure and might slide further below $55,500 in the near term.
Bitcoin Price Faces Hurdles
Bitcoin price attempted another upside break above the $58,000 resistance zone. However, BTC failed to gain strength for a clear move above the $57,500 and $58,000 levels.
A high was formed near $57,850 and the price started a fresh decline. There was a break below the $57,500 and $57,200 levels. The bears pushed the price below the 50% Fib retracement level of the upward move from the $55,362 swing low to $57,850 high.
Bitcoin is now trading below $57,500 and the 100 hourly simple moving average. There is also a crucial bearish trend line forming with resistance near $57,300 on the hourly chart of the BTC/USD pair.
An immediate support is near the $56,300 level. It is close to the 61.8% Fib retracement level of the upward move from the $55,362 swing low to $57,850 high. The first major support is now forming near the $56,000 level. The main breakdown support is still near the $55,500 level.
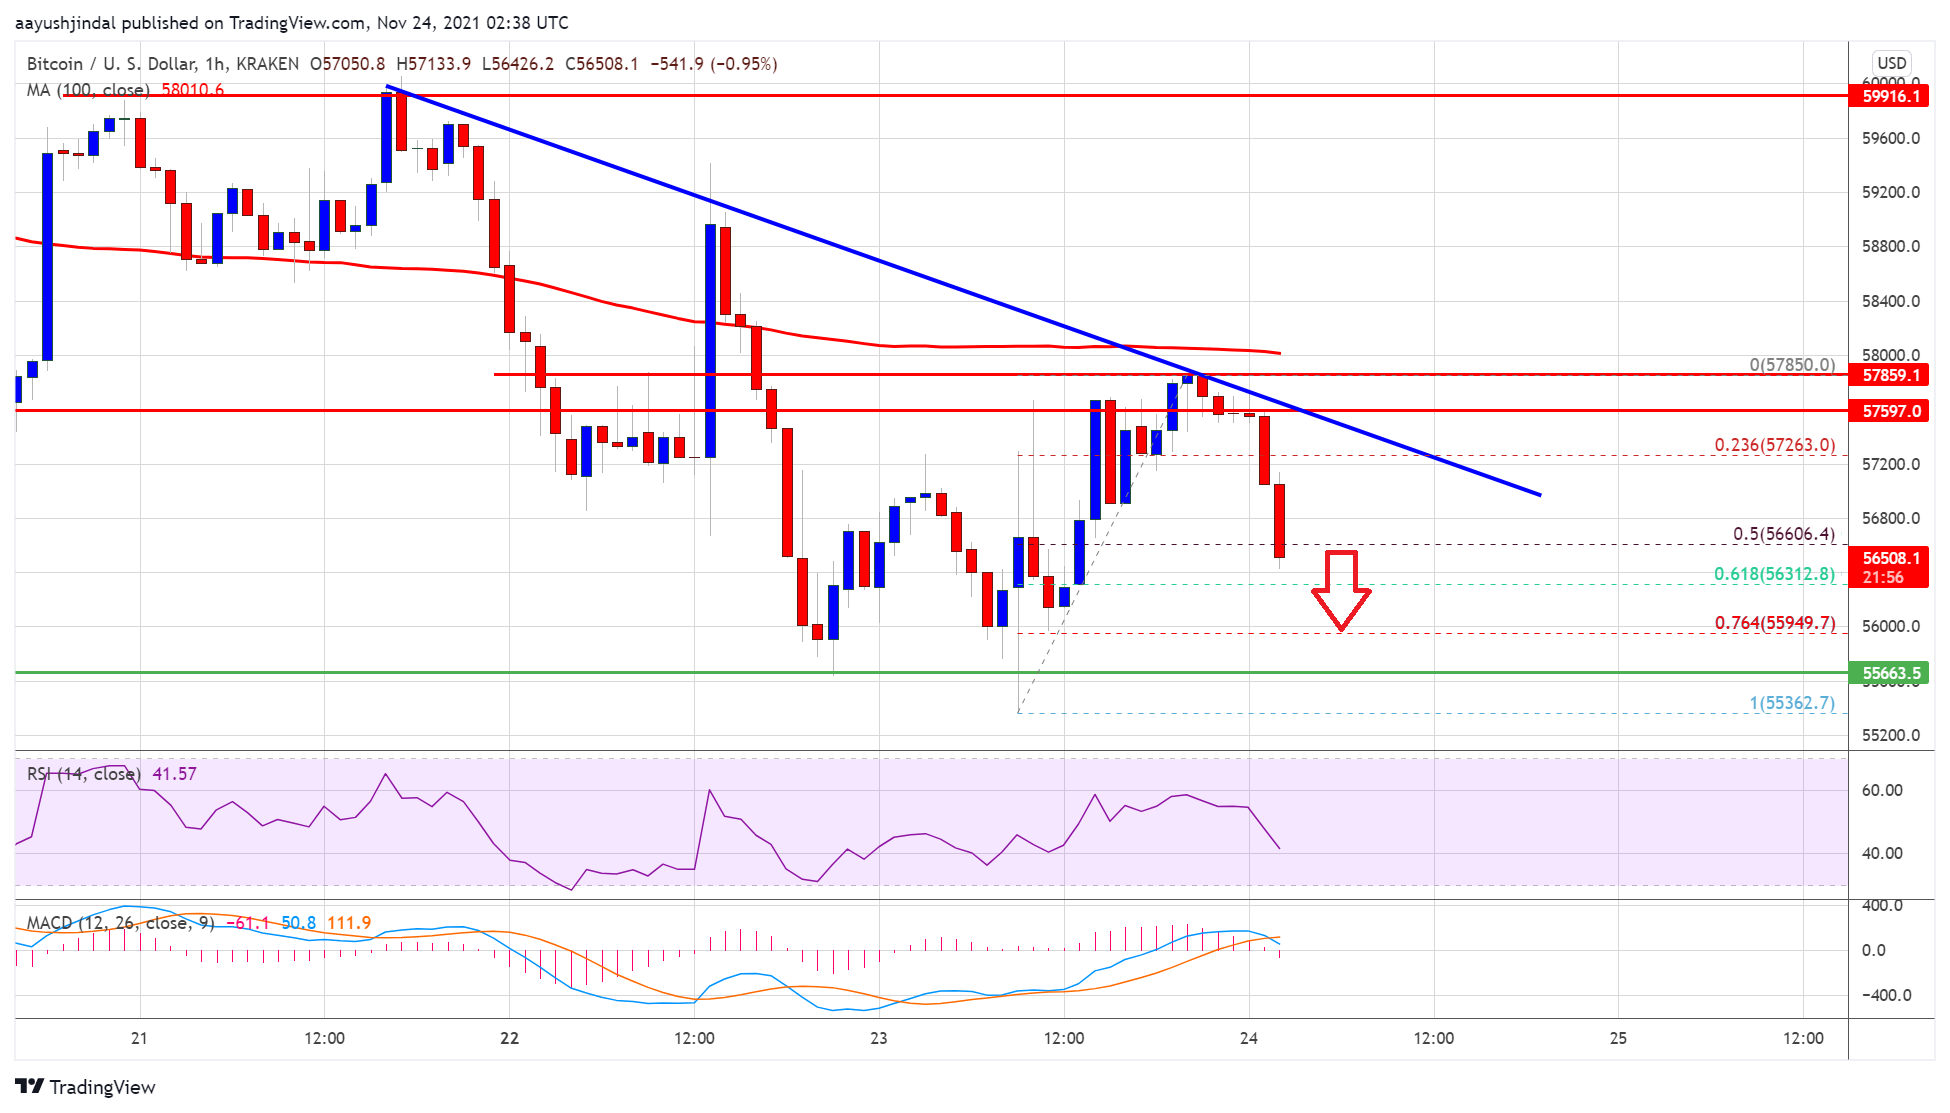
Source: BTCUSD on TradingView.com
A downside break below the $55,500 level could spark more losses. In the stated case, the price might even decline below the $55,000 level. The next major support could be near the $53,200 level.
Upside Limited In BTC?
If bitcoin stays above the $55,500 support, it could attempt a fresh recovery wave. On the upside, an initial resistance is near the $57,000 level.
The first key resistance is near the $57,500 level and the trend line zone. The next major resistance sits near the $57,850 level and the 100 hourly simple moving average, above which the price might rise towards the $59,200 level.
Technical indicators:
Hourly MACD – The MACD is now gaining pace in the bearish zone.
Hourly RSI (Relative Strength Index) – The RSI for BTC/USD is below the 50 level.
Major Support Levels – $56,000, followed by $55,500.
Major Resistance Levels – $57,200, $57,500 and $58,000.