Monday, January 13, 2025
Home Blog Page 33

Crypto Twitter: Rising Ethereum Gas Fees led to ConstitutionDAO Failed the Bid

0
Crypto Twitter

Rising Ethereum gas fees have outraged crypto fans, ConstitutionDAO has to work out how to refund lots of people their donations plus gas fees, and a popular new NFT project has received allegations of racism… and theft!

This week, crypto’s Twitter fingers vented their frustration over the rising cost of Ethereum gas fees, ConstitutionDAO failed to win the bid for a copy of the U.S. constitution, leaving many wondering what will happen to the funds it raised, and a load of cartoon apes has stirred up controversy in the NFT world. Here’s our roundup of the most notable events on Crypto Twitter this week.

The CEO of Singaporean crypto hedge fund Three Arrows Capital, Zhu Su, joined the chorus of dismayed voices tweeting about rising Ethereum gas fees this week. Back in August, Ethereum launched the “Altair” upgrade, which changed the way miners get paid and introduced staking to the ecosystem. However, Ethereum’s gas fees have risen roughly in line with its price over the last few months.

Early on Sunday afternoon, Su tweeted: “Yes I have abandoned Ethereum despite supporting it in the past. Yes Ethereum has abandoned its users despite supporting them in the past. The idea of sitting around jerking off watching the burn and concocting purity tests, while zero newcomers can afford the chain, is gross.”

While many were quick to agree with Su, a few were more critical. One Twitter user complained that Su blocked him after he tweeted that Su “loaded up on AVAX then started telling people it was the future. He’s a [market maker] and anyone taking this for face value needs to consider the driving motives (to make a shit ton of money convincing everyone eth bad, AVAX future).”

Ethereum competitor Avalanche certainly benefited from the press. Avalanche briefly entered the top 10 cryptocurrencies by market capitalization earlier on Sunday. The native token for the blockchain, which touts cheaper gas fees and greater speeds than Ethereum, set a new all-time high of $146 on Sunday afternoon, according to CoinMarketCap.

In a story that’s tangentially related to Ethereum’s gas fees, many crypto fans on Twitter were talking about ConstitutionDAO this week. ConstitutionDAO was set up to raise funds to buy an extremely rare first-edition copy of the U.S. constitution, which was being auctioned through Sotheby’s. The DAO raised over $40 million before ultimately losing the auction to no-coiner Citadel CEO Ken Griffin.

ince ConstitutionDAO is now faced with the mammoth task of refunding all the money it received back to the donors, a big part of the Twitter conversation revolved around the awkward question of refunding the gas fees donors paid to send Ethereum to the DAO. 

Richard Chen, a general partner at crypto investment firm 1confirmation, tweeted that “ConstitutionDAO members have collectively spent 199.38 ETH ($860k) in gas”.

After losing the auction, ConstitutionDAO tweeted that the money “will of course be refunded to everyone who participated”, but it remains an open question as to how that will happen. Crypto journalist Laura Shin tweeted a clip from an interview with Will Papper, a ConstitutionDAO contributor who helped organize the bid. 

Several refund options are being discussed, including the possibility of a layer 2 solution, where the refunds would be meted out on a sidechain separate to, but connected with, Ethereum. This option is pretty hard, as many donors were first-time or crypto-naive Ethereum users. At the time of writing, no further clarification has been given by the DAO. 

A new sold-out collection of 5,000 Ethereum NFTs called “Lil Baby Ape Club” which is inspired by, but not affiliated with, the immensely popular Bored Ape Yacht Club has provoked feelings of outrage over its controversial artwork, which some are perceiving as racist. 

Proud BAYC owner @BenMayorWhite shared a screenshot of a Lil Baby Ape Club avatar and tweeted: “Skinhead trait + German flag suspenders +monkey pride written on tee. Unforgiveable [sic] and atrocious. @LilBabyApeClub you should be completely ashamed.”

Ben’s tweet blew up, and more outraged NFT fans joined the conversation. Twitter user @UglyMoms wrote: “Research the term ‘jam boy’ and try to defend this project”.

The biggest twist came when @0xRoh tweeted an article he wrote about. the BAYC spinoff project, which was trading at 30x its initial mint price half a day after hitting the market. According to @0xRoh the token contract was stolen from its original creators. 

There has been no shortage of drama this week. Is Zhu Su right to totally dismiss Ethereum over the gas fees? Will ConstitutionDAO manage to successfully refund every donor? Gas fees and all? Who are the original creators of Lil Baby Ape Club and why are they flirting with racist imagery? This week’s Crypto Twitter was rife with questions and speculation, but lacking in answers.

The entire crypto market has suffered this week But today it is recovering

0
SHIB Lead Crypto Market Recovery

Bitcoin is currently trading at around $58,000 per coin, while SOL and SHIB are seeing double digit daily gains.

  • The entire cryptocurrency market has suffered this week because of a huge sell-off.
  • But today it is recovering.
  • Bitcoin isn’t up that much in the past 24 hours—but various altcoins are.

The cryptocurrency market has bounced back after yesterday’s sell-off—with altcoins Shiba Inu and Solana leading the recovery. 

Markets on Thursday were hit hard after already suffering a rough week. Bitcoin, the largest cryptocurrency by market cap, hit its lowest price in a month. The sell-off came after the crypto asset hit an all-time high of $69,044 on November 10. 

The rest of the crypto market followed—as it usually does—and shed $150 billion in five days. 

But today, things are looking better. Bitcoin initially sank further and hit a low of around $55,000 before bouncing to a daily high of $58,460, per data from CoinGecko.

Still, that’s only a 0.3% gain for Bitcoin on the day, though other crypto assets are today doing much better. All in all, the crypto market has gained nearly 5% today and currently stands at a collective $2.7 trillion market cap.

Shiba Inu—or SHIB—is today’s shining star: it’s up 19.4% in the past 24 hours, trading at $0.00005124. Shiba Inu is the eleventh largest digital asset by market cap—and one of the most talked about at the moment due to its impressive gains: it runs on the Ethereum network and is based on an internet meme. 

Despite having no real utility, it has a market cap of over $27 billion.

Solana, the fifth biggest digital asset which does have utility, is up nearly 10% in the past 24 hours—at $214.92 a coin. The cryptocurrency is an Ethereum competitor and it’s used to pay for transactions on what’s quickly become the second-largest network for DeFi and NFT trading activity. 

DeFi, shorthand for “decentralized finance,” describes a group of products and services that allow users to trade, borrow, and lend crypto assets without third-party intermediaries. There is now more than $13 billion locked up in Solana DeFi protocols, per data from DeFi Llama. As a result, Solana has soared in value in the past year: it’s up over 10,000% since November 2020. 

Ethereum, the second biggest cryptocurrency, is up 4.3% in 24 hours, trading at $4,242, while Binance Coin, the native token for the world’s biggest crypto exchange, is up 6.2%—trading for $578.90.

It’s possible that markets have suffered this week, in part, because U.S. President Joe Biden signed a $1.2 trillion infrastructure bill on Monday. The bill included new tax reporting requirements for certain crypto users that are now defined as “brokers” by the new law. The new definition, if cast broadly, will mean that cryptocurrency miners, software developers, and stakers could be subject to “impossible” requirements and a “cumbersome surveillance system,” according to crypto advocacy and civil liberties groups.

Crypto investors may have been relieved to learn this week, however, that these new requirements would not go into effect until January 1, 2024. What’s more, several members of Congress are currently working to amend or repeal the crypto tax provisions in the law.

ETH Price Analysis: the strong bullish pattern could bring significant bullish momentum

0
Ethereum Price Analysis In Correction Phase

The ETH/ BTC chart shows the coin price has been trapped in a consolation period for more than six month now. However, looking at the bigger picture, the coin displays a strong bullish pattern in play, which could bring significant bullish momentum to this coin. Watch for these important levels for ETH.

  • The ETH coin price action forms a Cup and Handle pattern 
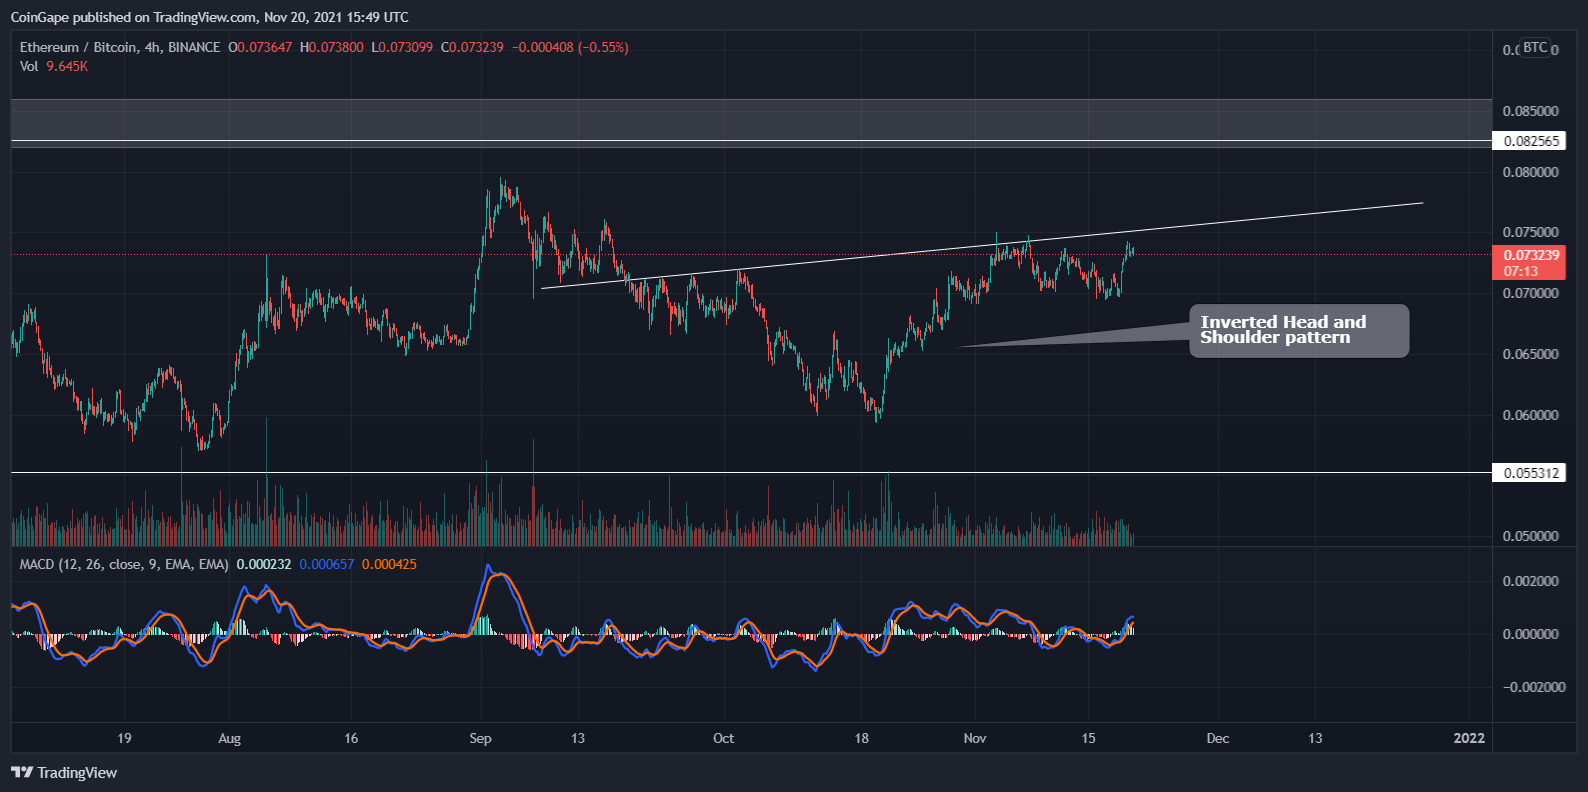
  • The ETH coin forms an inverted head and shoulder pattern in the 4-hour time frame chart. 
  • The intraday trading volume in the ETH coin is $16.3 Billion, indicating a 32.5% loss.
TradingView Chart

Source- ETH/BTC chart by Tradingview

The ETH technical chart presents a Cup and Handle pattern in the daily time frame chart. The pattern has its neckline(resistance zone) at 0.086 BTC-0.0825 BTC. However, the coin price is still busy forming the handle portion of this pattern.

Once the ETH price gives a decisive breakout from the overhead resistance, the crypto traders could grab an excellent long opportunity in this coin. As with the completion of this pattern, the ETH price could surge to 0.123 BTC.

The crucial EMAs(20, 50, 100, and 200) show the bullish alignment for the ETH coin. The Relative Strength Index value at 58 indicates the coin maintains a positive sentiment among the market participants. However, the RSI chart bearish divergence in its chart suggests to keep your guard up.

ETH/BTC Chart In The 4-hour Time Frame

Source- ETH/BTC chart by Tradingview

The remarkable rally of ETH coin faced strong resistance from the 0.83 BTC level on March 15th, and since then, the price has kept resonating in a short-range, stretching from 0.55 BTC to 0.825 BTC.

Moreover, the chart reveals another bullish pattern in this lower time frame, i.e., an inverted head and shoulder pattern. This bullish pattern can provide enough boost to the coin price and help it rechallenge the crucial resistance of 0.825 BTC for a bullish breakout.

Moving Zcash to proof of stake: 20% raise on ZEC price in one day

0
Moving Zcash to proof of stake: 20% raise on ZEC price in one day

The massive upside move comes as a part of a rebound that started Friday after Electric Coin Company discussed the prospects of moving Zcash to proof-of-stake.

Zcash (ZEC) surged by nearly 20% in the past 24 hours, helped by the euphoria surrounding its core protocol’s decisive transition from Proof-of-Work (PoW) to Proof-of-Stake (PoS).

The ZEC price logged an intraday high at $188.80 on Binance after rising two days in a row by more than 27%. The cryptocurrency’s move upside also wiped out a big portion of the losses it had faced earlier this week, in the wake of a downside retracement across the crypto market. 

ZEC price jumped after the cryptocurrency’s main developer, Electric Coin Company (ECC), announced that it would move Zcash’s protocol from PoW to PoS within the next three years. The nonprofit noted that the upgrade would limit the ZEC price’s downward pressures by removing miners that “immediately liquidate” the token for Bitcoin or fiat.

“This shift will also increase the utility for ZEC through capabilities that include yield generation through staking and a possible path to on-chain governance mechanisms for ZEC hodlers,” added Josh Swihart, the senior vice president of growth at ECC, adding:

“There are other benefits of moving to proof of stake which include the reduction of the ZEC energy footprint, providing a possible path to on-chain governance mechanisms, and support for interoperability by addressing problems with proof-of-work transaction finality, among other reasons.”

ZEC/USDT daily price chart. Source: TradingView 

ZEC bulls cashing on the PoS FOMO

Unlike PoW, PoS mechanisms allow a person to mine or validate block transactions based on the number of underlying tokens they hold/stake. In return, the so-called “validator” receives rewards in the form of yields.

Ethereum, the leading smart contracts platform by market cap, also initiated its transition from PoW to PoS after introducing a dedicated smart contract. In response, users locked about 8.33 million Ether (ETH) tokens into the so-called Ethereum 2.0 address, effectively pushing them out of active supply.

ETH/USD weekly price chart. Source: TradingView

ECC’s announcement promised that users would be able to stake a portion of their ZEC holdings into a dedicated Zcash smart contract to become validators on its blockchain. Therefore, as a result, more ZEC may end up going out of active circulation due to lockup periods, against its Bitcoin-like fixed supply of 21 million tokens.

Barry Silbert, the founder, and CEO of Digital Currency Group — a venture capital firm tweeted Saturday that he would “buy more” Zcash tokens, citing their supply cap. His tweet coincided with a sudden ZEC price rise against the U.S. dollar and Bitcoin (BTC).

Nonetheless, some analysts argued that Zcash would not have a supply cap after implementing PoS.

For instance, on-chain analyst Willy Woo noted in his response to Silbert’s tweet that if Zcash could “decide to extend the dev tax,” and “if it can switch to PoS and cut out the miners,” then he is confident that the cryptocurrency does not have a maximum supply.

“And,” Woo added, “that’s ignoring the inflation bug of 2018 and assuming we could in fact audit the supply,” referring to the Zcash’s infamous vulnerability that could have created infinite ZEC tokens.

Minutes after Woo’s remarks on ZEC’s doubtful supply ca, Silbert tweeted:

Inflection zone

ZEC’s latest push upside made it enter an inflection zone, prominent for its record of capping the cryptocurrency’s rallies.

Specifically, the trading range defined by $170-$205 (the reddened area in the chart below) has earlier provided selling opportunities for traders. Even recently, the ZEC price retreated lower after entering the said range while eyeing extended declines toward the purpled upward sloping trendline.

ZEC/USDT three-day price chart. Source: TradingView

A clear breakout trend may appear after ZEC closes above the inflection zone, accompanied by rising trading volumes, thus targeting the Fibonacci retracement levels at $247 and $316. Conversely, a decisive close below $170 may risk sending ZEC toward $136.

Crypto Kingpin Drops $12 Million on Sleek Sunset Strip Mansion

0
Crypto Kingpin Drops $12 Million on Sleek Sunset Strip Mansion

At the tender age of 27, Yunfan “Chandler” Song is living the dream. The UC Berkeley grad and ex-Amazon software engineer is now the high-flying CEO of Ankr Network, which has quickly become one of the cryptocurrency world’s hottest startups. Apart from Ankr, Song is also the cofounder of NFT auction platform Bounce; in 2019, he was named to Forbes’ annual “30 under 30” list as one of their “Big Money” startup founders.

Those accolades have brought the millennial entrepreneur fame, at least within the crypto community, fortune and fancy cars. Now they’ve also bought him a $12 million house in one of L.A.’s most exclusive neighborhoods.

Looming high above the iconic Sunset Strip, the ultra-contemporary home was built in 2017 as one of the final designs of Austin Kelley, the late founder of XTEN Architecture. The snow-white and slab-sided mansion packs five bedrooms and six bathrooms into nearly 7,500 square feet of living space, all of it with the high-wattage visual drama and glitz associated with these showy sorts of Hollywood Hills houses.

The property sits in a neighborhood pocket of the hills known as Doheny Estates, immediately adjacent to the far more famous Bird Streets area. Controversial developer Philip Rahimzadeh bought the lot way back in 2004 and spent years of planning and construction to bring the existing mansion to life. Completed in early 2019, the house was initially offered with a nearly $17 million ask, ultimately spending spent more than two years on the market — at a wide variety of prices — before Song’s lowball offer was finally accepted.

It seems certain that building the house took some very expensive engineering, as it’s set onto a steeply-sloped lot that backs up to a nearly sheer mountain. Huge retaining walls encircle the blocky structure, and the entire place is elevated well above the street out front, with the front door set atop a twisty staircase.

AVAX, ENJ and EGLD are posting a fresh round of all-time highs

0
BNB, SHIB and SOL Price Analysis: 27 November

AVAX, ENJ and EGLD brush off the recent drop in BTC price by posting a fresh round of all-time highs.

Its been a rollercoaster week in the cryptocurrency market after volatility returned to shake up Bitcoin (BTC) price, pushing the digital asset to lows not seen since mid-October. 

As has happened frequently in the past, the drop in price of BTC was followed by a rotation into altcoins and the Altseason Indicator suggests that the current market conditions are similar to those seen in the past when altcoins outperformed Bitcoin.

Altseason indicator. Source: Cointelegraph Markets Pro

Here’s a look at a few altcoins that have been making steady gains over the past few weeks.

Avalanche’s DeFi ecosystem explodes

Avalanche (AVAX) is a layer-one blockchain protocol that has risen in popularity over the course of 2021 as its decentralized finance (DeFi) and nonfungible token (NFT) ecosystems have grown, thanks in part to the low-fee nature of the protocol attracting users and liquidity from Ethereum.

VORTECS™ data began to detect a bullish outlook for AVAX on Nov. 5, prior to the recent price rise.

The VORTECS™ Score, exclusive to Cointelegraph, is an algorithmic comparison of historical and current market conditions derived from a combination of data points including market sentiment, trading volume, recent price movements and Twitter activity.

VORTECS™ Score (green) vs. AVAX price. Source: Cointelegraph Markets Pro

As seen in the chart above, the VORTECS™ Score for AVAX began to pick up on Nov. 5 and reached a high of 83, just as the price of AVAX began to increase by 54.76% over the next two weeks.

The climbing price of AVAX comes as the DeFi ecosystem on Avalanche saw its total total value locked on the network rise to new highs and this week Binance US announced plans to list the token.

Enjin aims for a Polkadot parachain slot

Enjin (ENJ) is a protocol that operates on the Ethereum (ETH) network and focuses on the creation of blockchain-based gaming products and nonfungible tokens.

Data from Cointelegraph Markets Pro and TradingView shows that since hitting a low of $1.19 on Sept. 29, the price of ENJ has blasted 213.5% higher to a daily high at $3.74 on Nov. 19 as its 24-hour trading volume spiked 92% to $1.57 billion.

ENJ/USDT 4-hour chart. Source: TradingView

The rising strength for ENJ in November comes as the Enjin ecosystem aims to secure a spot as a Polkadot parachain via the crowdloan auction for its cross-chain metaverse project Efinity.

Elrond announces a $1.29 billion liquidity incentive program

Elrond is a blockchain protocol aimed at becoming the technology ecosystem for the “new internet” and it uses sharding technology to enable its network to process 15,000 transactions per second (TPS) with an average transaction cost of $0.001.

VORTECS™ data from Cointelegraph Markets Pro began to detect a bullish outlook for EGLD on Nov. 12, prior to the recent price rise.

VORTECS™ Score (green) vs. EGLD price. Source: Cointelegraph Markets Pro

As seen in the chart above, the VORTECS™ Score for EGLD began to pick up on Nov. 12 and reached a high of 76, around 108 hours before the price of EGLD began to increase by 30.27% over the next three days.

The building momentum for EGLD comes as the protocols Maiar decentralized exchange (DEX) officially launched alongside a $1.29 billion liquidity incentive program designed to help attract users and liquidity to its DeFi ecosystem.

The overall cryptocurrency market cap now stands at $2.59 trillion and Bitcoin’s dominance rate is 42.2%.

Why Bitcoin price bottomed at $56,500?

0
Why Bitcoin price bottomed at $56,500

The absence of cascading liquidations, 25% delta skew and the margin lending ratio all suggest that Bitcoin price bottomed at $56,500.

The first rule of Bitcoin (BTC) trading should be “expect the unexpected.” In just the past year alone, there have been five instances of 20% or higher daily gains, as well as five intraday 18% drawdowns. Truth to be told, the volatility of the past 3-months has been relatively modest compared to recent peaks.

Bitcoin historical 90-day annualized volatility. Source: TradingView

Whether it be multi-million dollar institutional fund managers or retail investors, traders new to Bitcoin are often mesmerized by a 19% correction after a local top. Even more shocking to many is the fact that the current $13,360 correction from the Nov. 10 $69,000 all-time high took place over nine days.

The downside move did not trigger alarming-raising liquidations

Cryptocurrency traders are notoriously known for high-leverage trading and in just the past 4 days nearly $600 million worth of long (buy) Bitcoin futures contracts were liquidated. That might sound like a decent enough number, but it represents less than 2% of the total BTC futures markets.

Bitcoin futures aggregate open interest. Source: Coinglass.com

The first evidence that the 19% drop down to $56,000 marked a local bottom is the lack of a significant liquidation event despite the sharp price move. Had there been excessive buyers’ leverage at play, a sign of an unhealthy market, the open interest would have shown an abrupt change, similar to the one seen on Sept. 7.

The options markets’ risk gauge remained calm

To determine how worried professional traders are, investors should analyze the 25% delta skew. This indicator provides a reliable view into “fear and greed” sentiment by comparing similar call (buy) and put (sell) options side by side.

This metric will turn positive when the neutral-to-bearish put options premium is higher than similar-risk call options. This situation is usually considered a “fear” scenario. The opposite trend signals bullishness or “greed.”

Bitcoin 30-day options 25% delta skew. Source: Laevitas.ch

Values between negative 7% and positive 7% are deemed neutral, so nothing out of the ordinary happened during the recent $56,000 support test. This indicator would have spiked above 10% had pro traders and arbitrage traders detected higher risks of a market collapse.

Margin traders are still going long

Margin trading allows investors to borrow cryptocurrency to leverage their trading position, therefore increasing the returns. For example, one can buy cryptocurrencies by borrowing Tether (USDT) and increasing their exposure. On the other hand, Bitcoin borrowers can only short it as they bet on the price decrease.

Unlike futures contracts, the balance between margin longs and shorts isn’t always matched.

OKEx USDT/BTC margin lending ratio. Source: OKEx

The above chart shows that traders have been borrowing more USDT recently, as the ratio increased from 7 on Nov. 10 to the current 13. The data leans bullish because the indicator favors stablecoin borrowing by 13 times, so this could be reflecting their positive exposure to Bitcoin price.

All of the above indicators show resilience in the face of the recent BTC price drop. As previously mentioned, anything can happen in crypto, but derivatives data hints that $56,000 was the local bottom.

Crypto crime on DeFi platforms and has caused over €9 billion in losses

0

Fraud and theft at decentralised finance platforms has totalled $10.5 billion (€9.3 billion) so far this year, newly-published research showed on Thursday, laying bare the risks in the fast-growing but still mostly unregulated area of cryptocurrencies.

It is all due to Decentralised Finance (DeFi) platforms, according to the study.

DeFi is a blockchain-based platform that allows users to lend, borrow and save (usually in cyrptocurrencies), but it can be done without the traditional gatekeepers of finance such as banks.

Instead, it uses smart contracts, which are software programs that allow for agreements on the blockchain. Backers say the technology offers cheaper and more efficient access to financial services.

Cash has poured into DeFi sites this year, mirroring the explosion of interest in cryptocurrencies as a whole. Many investors, facing historically low or sub-zero interest rates, are drawn to DeFi by the promise of high returns on savings.

Advertisement

IRS Seized $3.5 Billion in Crypto

0
Crypto-Crime-Rise
Crypto-Crime-Rise

The United States Internal Revenue Service (IRS) seized cryptocurrency worth $3.5 billion during the fiscal year of 2021.

According to the latest IRS criminal investigation report, this figure represents 93% of assets seized by tax enforcement over the past year.

The tax collection agency believes that it could seize further billions in crypto from tax fraud and other crimes over the coming year.

“I expect a trend of crypto seizures to continue as we move forward into fiscal year ‘22,” said IRS Criminal Investigation Chief Jim Lee. “We’re seeing crypto involved in a number of our crimes as we move forward.”

Advertisement

Price analysis November 17: BTC and some altcoins

0
Bitcoin, Ethereum And Altcoins Price Analysis

Bitcoin and most major altcoins are attempting to hold above their immediate resistance levels, a sign that bulls could be buying on each dip.

Bitcoin (BTC) and Ether (ETH) are testing psychologically important support levels at $60,000 and $4,000 respectively. Both these levels are critical to keeping the uptrend intact in the short term.

While the fall may scare off leveraged traders, Bitcoin whales seem to be viewing this dip as a buying opportunity. On-chain data shows that the third-largest Bitcoin whale added 207 Bitcoin to the holdings at an average price of about $62,053 per Bitcoin.

After the latest purchase, the whale’s holding has increased by 635 Bitcoin in November, according to journalist Colin Wu.

Daily cryptocurrency market performance. Source: Coin360

However, it is not all bullish news for Bitcoin and cryptocurrencies. The U.S. dollar has risen to a sixteen-month high on expectations that soaring inflation may force the United States Federal Reserve to raise rates and accelerate the tapering of its $120 billion a month asset purchase program.

LMAX Group currency strategist Joel Kruger also said that a strengthening dollar may hit risky assets the hardest and that could be the reason for the recent pullback in Bitcoin and altcoins.

Will bulls defend the strong support levels and stage a recovery or will aggressive selling pull crypto prices below their strong support levels? Let’s study the charts of the top 10 cryptocurrencies to find out.

BTC/USDT

Bitcoin plummeted below the 20-day exponential moving average (EMA) ($62,607) and the support line of the rising wedge pattern on Nov. 16. This is the first sign that bulls may be losing their grip.

BTC/USDT daily chart. Source: TradingView

The buyers are attempting to defend the 50-day simple moving average (SMA) ($59,122) but the shallow bounce indicates a lack of urgency among the bulls to buy at current levels.

If the price turns down from the current level or the 20-day EMA, the bears will try to sink the BTC/USDT pair below $57,820. If they succeed, the selling could pick up momentum and the pair may plummet to $52,500.

Contrary to this assumption, if the price turns up from the current level and rises above the 20-day EMA, it will indicate strong accumulation at lower levels. The pair could then retest the overhead zone at $67,000 to $69,000.

ETH/USDT

Ether broke below the ascending channel on Nov. 15 and that was followed by further selling on Nov. 16, which pulled the price below the 20-day EMA ($4,439). This was the first close below the 20-day EMA since Oct. 1.

ETH/USDT daily chart. Source: TradingView

The long tail on Nov. 17’s candlestick suggests that bulls are attempting to defend the 50-day SMA ($4,033). The 20-day EMA has started to turn down and the relative strength index (RSI) has dropped in the negative zone, indicating that bears are making a comeback.

If the price turns down from the current level or the 20-day EMA, it will suggest that sentiment has turned negative and traders are selling on rallies. The ETH/USDT pair could then breach the 50-day SMA and plummet to the next support at $3,600.

This bearish view will be negated if the pair rises from the current level and breaks above the 20-day EMA.

BNB/USDT

Binance Coin (BNB) turned down from the overhead resistance at $669.30 on Nov. 15 and plunged below the 20-day EMA ($591) on Nov. 16. The selling continued on Nov. 17 and the bears pulled the price near the 50% Fibonacci retracement level at $552.30.

BNB/USDT daily chart. Source: TradingView

The long tail on Nov. 17’s candlestick suggests strong buying at lower levels. The buyers will now try to push the price back above the 20-day EMA. If they manage to do that, the BNB/USDT pair will again try to rise to $669.30.

Alternatively, if the price turns down from the 20-day EMA, it will suggest that the sentiment has turned negative and traders are selling on rallies. The pair could then extend its decline to the 50-day SMA ($509).

SOL/USDT

Solana (SOL) plunged below the ascending channel and the 20-day EMA ($224) on Nov. 16, indicating that the bulls may be losing their grip. The buyers are attempting to defend the breakout level at $216 but any bounce is likely to face selling at higher levels.

SOL/USDT daily chart. Source: TradingView

The 20-day EMA has flattened out and the RSI has dropped to the midpoint, indicating a balance between supply and demand. This equilibrium will shift in favor of the bears if the price breaks and sustains below $216.

On the contrary, if the price rebounds off the current level, the SOL/USDT pair could rise to the downtrend line. This level may act as a stiff resistance but if bulls clear this hurdle, the pair may retest the all-time high at $259.90.

ADA/USDT

Cardano (ADA) turned down sharply on Nov. 16 and broke below the critical support at $1.87 but a minor positive is that bulls did not allow the price to close below it. The long tail on the candlestick indicates that buyers are attempting to defend the support.

ADA/USDT daily chart. Source: TradingView

The bulls are attempting to push the price back above $1.87 on Nov. 17 but higher levels may attract selling. Both moving averages have started to turn down and the RSI has dipped into the negative zone, indicating that bears are in command.

If the price turns down from the current level or the 20-day EMA, the bears will try to sink the ADA/USDT pair below $1.75. If they manage to do that, the pair could drop to $1.50. The first sign of strength will be a break and close above the downtrend line.

XRP/USDT

The long wick on Ripple’s, or XRP‘s, Nov. 15 candlestick shows that bears sold on rallies to the overhead resistance at $1.24. The selling accelerated on Nov. 16 and bears pulled the price back below the moving averages.

XRP/USDT daily chart. Source: TradingView

If bears sustain the price below the moving averages, the XRP/USDT pair could challenge the strong support at $1. The 20-day EMA ($1.15) has started to turn down and the RSI has dipped into the negative territory, indicating that bears have a slight edge.

A break and close below $1 could pull the price to $0.85. This level may again act as a strong support but if it cracks, the next stop could be $0.70.

Conversely, if the price breaks above the moving averages, the pair could rise to $1.24. The bulls will have to push and sustain the price above this level to signal a comeback.

DOT/USDT

Polkadot’s (DOT) failure to climb back above the 20-day EMA($45.99) may have prompted profit-booking from short-term bulls and selling by the aggressive bears. This intensified the selling and pulled the price below the 50-day SMA ($41.88) on Nov. 16.

DOT/USDT daily chart. Source: TradingView

The DOT/USDT pair is attempting to rebound off the uptrend line, indicating that bulls continue to buy on dips. If bulls sustain the price above the 50-day SMA, the pair could rise to the 20-day EMA.

This level is likely to again act as a barrier. If the price turns down from the 20-day EMA, the bears will make one more attempt to pull the pair below the uptrend line and extend the decline to $32 and later to $26.

The bulls will have to push and sustain the price above the 20-day EMA to indicate that the bears may be losing their grip.

DOGE/USDT

After trading between the moving averages for the past few days, Dogecoin (DOGE) made a decisive move lower on Nov. 16. This indicates that supply exceeds demand.

DOGE/USDT daily chart. Source: TradingView

The bulls are attempting to defend the support at $0.22. They will now try to push the price above the downtrend line. If they can pull it off, it will indicate that the bears may be losing their grip. The DOGE/USDT pair could then rise to $0.30.

However, the 20-day EMA ($0.25) has started to turn down and the RSI is in the negative territory, indicating that bears have the upper hand. If the price turns down from the current level or the downtrend line, the likelihood of a break below $0.22 increases. The pair may then drop to the critical support at $0.19.

SHIB/USDT

The bulls tried to sustain SHIBA INU (SHIB) above the 20-day EMA ($0.000052) on Nov. 14 and 15 but the long wick on the candlestick shows selling at higher levels.

SHIB/USDT daily chart. Source: TradingView

The selling continued on Nov. 16, pulling the price below the 20-day EMA. A minor positive is that bulls are attempting to defend the critical support at $0.000043. If buyers push and sustain the price above the 20-day EMA, the SHIB/USDT pair could attempt to rise to the resistance at $0.000065.

Conversely, if the price turns down from the current level or the 20-day EMA, it will indicate that traders are selling on every minor rise. That will increase the possibility of a break below $0.000043 and the 50-day SMA ($0.000040). If that happens, the pair may complete a 100% retracement and drop to $0.000027.

AVAX/USDT

Avalanche (AVAX) is in an uptrend. The bears tried to stall the up-move and sink the price below the key support level at $81 on Nov. 16 but the bulls did not relent. The long tail on the day’s candlestick shows that buyers defended the 20-day EMA ($85.20) with vigor.

AVAX/USDT daily chart. Source: TradingView

Buying resumed on Nov. 17 and the bulls have pushed the price above the overhead resistance at $101.82. If buyers sustain the price above the psychologically critical level at $100, the AVAX/USDT pair could rise to $115.14.

The upsloping 20-day EMA and the RSI in the overbought territory indicate that bulls are in control. The bears will have to pull the price back below the breakout level at $81 to signal a possible change in the short-term trend.