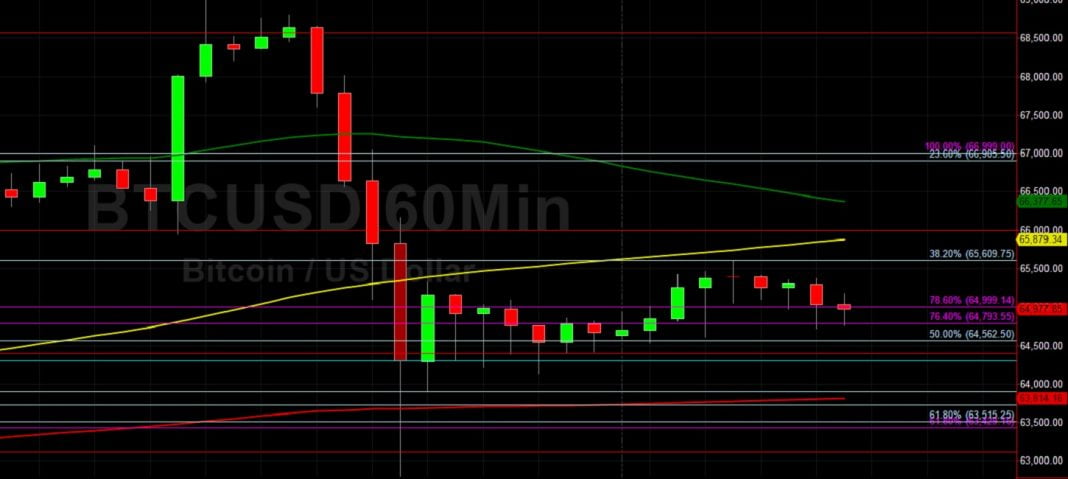
Bitcoin (BTC/USD) remained volatile early in the Asian session as traders continued to react to the pair’s gyrations after recently establishing a new lifetime high around the 69000 figure. Profit-taking followed the new all-time high earlier this week, and BTC/USD came off acutely to the 62800 area. Stops were elected below the 66905, 65609, 64562, and 63515 levels during the pullback, representing the 23.6%, 38.2%, 50%, and 61.8% retracements of the appreciating range from 60125 to 69000. Technical support finally emerged just above the 23.6% retracement of a recent appreciating range from 57653.88 to 64300.
Traders remain focused on the psychologically-important 70000 figure, and technical sentiment continues to be supportive and constructive. Following the pair’s recent gains, downside retracement levels and areas of potential technical support include the 62219 and 62024 levels. Traders are observing that the 50-bar MA (4-hourly) is bullishly indicating above the 100-bar MA (4-hourly) and above the 200-bar MA (4-hourly). Also, the 50-bar MA (hourly) is bullishly indicating above the 100-bar MA (hourly) and above the 200-bar MA (hourly).
Price activity is nearest the 50-bar MA (4-hourly) at 63852.63 and the 100-bar MA (Hourly) at 65878.92.
Technical Support is expected around 53997.15/ 51245.86/ 49022.22 with Stops expected below.
Technical Resistance is expected around 69000/ 69449.40/ 77565.60 with Stops expected above.
On 4-Hourly chart, SlowK is Bullishly above SlowD while MACD is Bearishly below MACDAverage.
On 60-minute chart, SlowK is Bearishly below SlowD while MACD is Bullishly above MACDAverage.


