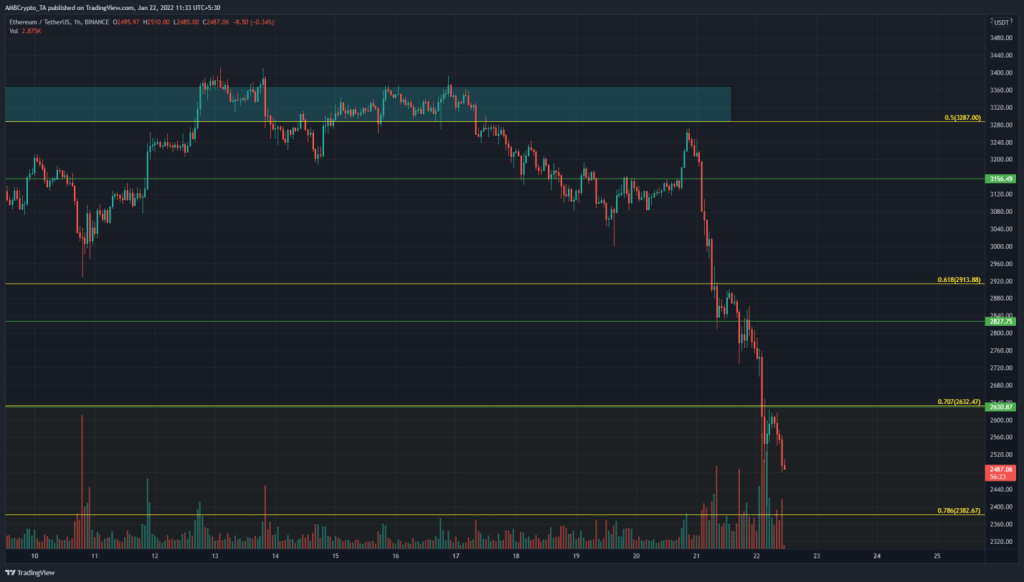
Ethereum was struggling to wade out of the $3300 area. There appeared to be no buyers in sight and bidders have been overwhelmed once the price fell below $3287 and almost retested the same level as resistance. Ethereum’s movement on the chart would depend on Bitcoin, and Bitcoin was not strong on the charts either. It would not be surprising if Ethereum saw a further 20% loss from where it was trading at the time of writing.

Cryptocurrencies have taken a nosedive in value following global stocks taking a hit and major indices such as the Nasdaq Composite having a bad start to 2022. This showed crypto was not as decoupled from the traditional markets as most hoped for, and that crypto remains a risk-on asset that investors flee from in times of uncertainty.
On the charts, Ethereum has lost around 25% since it retested the $3280 area a couple of days ago. Moreover, the weekend had arrived, and weekends generally have lower volume than weekdays. This meant a volatile move in either direction can not be ruled out.
For Ethereum, the 70.7% retracement level at $2632 was flipped to resistance, and next on the bears’ agenda was the $2382 level. Lower in the charts, Ethereum can expect $2382 and $2049 to act as support levels in the days to come.
Rationale

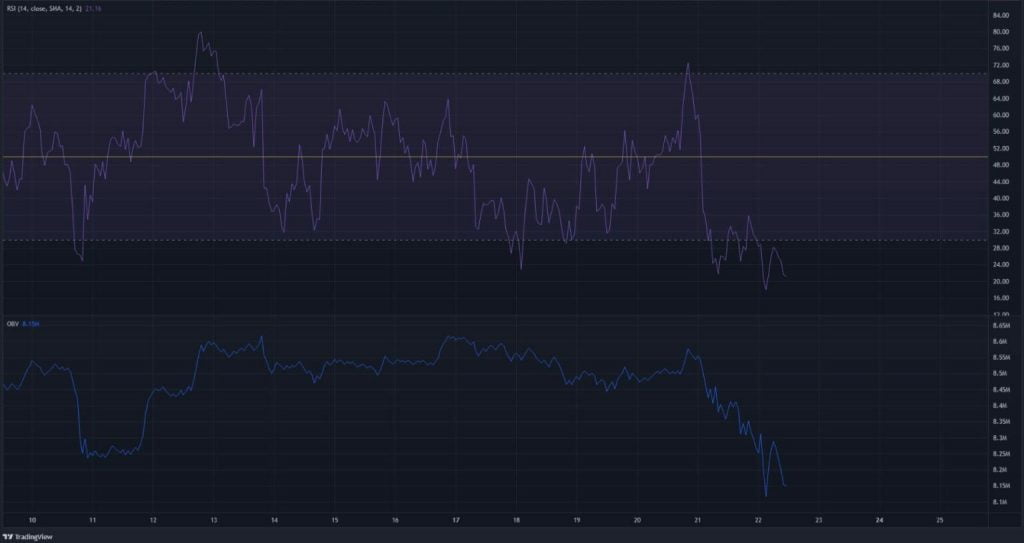
Although the hourly RSI appeared to form a higher low, even as the price formed a lower low (bullish divergence), this was simply not enough evidence of a shift in momentum. What this meant instead was possibly some sideways trading for Ethereum at the $2470 area. The RSI would likely climb upward during this phase, before diving lower once more.
The OBV showed that heavy selling volume was present in recent days.
Conclusion
Weekend volatility can not be ruled out. Yet at the time of writing, the momentum was strongly bearish on the lower timeframes. The $2382 and $2049 levels can be watched for a bounce.


