Wednesday, January 8, 2025
Home Blog Page 6

Bankman-Fried Pushes for Pre-Trial Release

0
Bankman-Fried Pushes for Pre-Trial Release

Sam Bankman-Fried is in trouble. He started the cryptocurrency company FTX. Now he is accused of stealing money from FTX customers.

Bankman-Fried wants to get out of jail more often. He says he needs more time to prepare his defense for his trial. The government offered to let him out two days per week. But his lawyers say that is not enough time. They say there is too much evidence to review.

Bankman-Fried has been in jail since last week. That’s when his $250 million bail was taken away. The court said he tried to get witnesses to lie. Some lawyers think Bankman-Fried should stop talking so much publicly about his case. It could hurt his chance for a fair trial. He has a court hearing on August 22. He is charged with fraud and conspiracy. If convicted, he could go to jail for decades.

The next few months will determine if Bankman-Fried can defend himself or if he will go to jail. It will be a big legal battle.

who is Sam Bankman-Fried

The Epic Rise and Fall of Crypto Pioneer Sam Bankman-Fried

Sam Bankman-Fried was once hailed as a genius in the volatile world of cryptocurrency. The former MIT physics major turned a crypto trading firm, Alameda Research, into a digital currency empire.

In 2019, Bankman-Fried launched the Bahamas-based FTX, which grew to become one of the largest crypto exchanges globally. At its peak, FTX was valued at over $30 billion. Bankman-Fried’s net worth topped $26 billion, making the young entrepreneur a crypto celebrity.

Yet in November 2022, it all came crashing down. A liquidity crisis engulfed FTX as news broke about its financially troubled trading arm. As customers rushed to withdraw billions in funds, FTX froze accounts and filed for bankruptcy.

The collapse shocked the crypto community. Billions in market value evaporated almost overnight. Now Bankman-Fried faces fraud charges that could land him in prison for decades.

From Boy Genius to Crypto King

Born in 1992 in California, Bankman-Fried was groomed for success from a young age. His parents were both Stanford Law professors. After graduating MIT in physics and math, he took a job at Wall Street firm Jane Street Capital.

In 2017, Bankman-Fried founded Alameda Research to trade crypto assets. Two years later, he launched FTX. The exchange drew praise for its slick trading platform and FTT token.

As cryptocurrencies soared in value during the pandemic, so did Bankman-Fried’s wealth and influence. He housed FTX in the Bahamas, away from US regulators. This enabled more risky leveraged trading for clients.

Behind the scenes, things were less rosy. Bankman-Fried was playing a dangerous game shuffling customer funds between FTX and Alameda. When crypto markets slid in 2022, the house of cards collapsed.

Epic Downfall and Fraud Charges

In early November 2022, concerns emerged about Alameda’s shaky finances. As users scrambled to withdraw $6 billion from FTX, the firm froze accounts. Bankman-Fried desperately sought a bailout, but rival exchanges passed.

Within days, FTX declared bankruptcy. Up to $2 billion in customer funds vanished from its accounts. Bankman-Fried resigned in disgrace as allegations of fraud mounted.

US prosecutors indicted Bankman-Fried on eight criminal counts, including wire fraud and money laundering conspiracy. He was arrested in the Bahamas and extradited to the US, pleading not guilty. If convicted, he faces up to 115 years in prison.

The Once-Lauded Crypto Pioneer Now Faces Ruin

Bankman-Fried once bailed out troubled crypto firms. Now, the collapsed CEO is defending himself against charges that could mean life behind bars. The saga illustrates the murky workings and risks in the largely unregulated crypto arena.

Billions in investor wealth has evaporated. While victims try to recover lost funds, Bankman-Fried must account for his central role in one of history’s biggest alleged frauds. The outcome will shape the young mogul’s future and the industry he helped build.

LATEST POSTS

Advertisement

Polkadot 2023-2032 Price Projections: What’s in Store for DOT?

0
Polkadot 2023-2032 Price Projections: What's in Store for DOT?

Polkadot Price Holds Steady As DOT Finds Support Near $4.50

Polkadot’s DOT token is currently trading at $4.49, down just 0.23% over the past 24 hours with a trading volume of $94 million. DOT maintains a market cap ranking of #11 at $5.5 billion market capitalization.

The circulating supply of Polkadot is around 1.25 billion DOT, though max supply details remain undisclosed. After recent volatility, DOT appears to have found solid support around the $4.50 level based on latest price action and trading volumes.

Polkadot Price Consolidates Following Sell-Off, DOT Trades Around $4.50

Polkadot’s native DOT token is presently valued at $4.49, recording minor losses of 0.23% in the past day amidst $94 million worth of trading volume. With a market capitalization of $5.5 billion, DOT holds the #11 spot and shows signs of consolidation after a steep sell-off.

There are approximately 1.25 billion DOT coins currently in circulation, however max supply is unknown. DOT has established support near the $4.50 mark according to the latest price movement and exchange flows.

Polkadot DOT Finds Footing at $4.50 After Drawdown, Trades Flat on Day

Polkadot’s DOT token has found its footing around the $4.50 level following a broad crypto market drawdown in recent weeks. DOT last traded at $4.49, down just 0.23% on the day, with $94 million in daily trading volumes.

The 11th-ranked cryptocurrency by market cap currently has a valuation of $5.5 billion based on a circulating supply of 1.25 billion DOT. Max token supply remains undisclosed. After its pullback, DOT appears to have established solid support at $4.50 based on the latest price action.

Polkadot price analysis: 

The latest Polkadot price analysis on August 19 reveals DOT has suffered a bearish reversal over the past 24 hours. DOT/USD currently trades at $4.49, down 0.23% from its opening of $4.51.

Polkadot now faces immediate resistance at $4.55, a level tested repeatedly in recent days but bulls have struggled to overcome. This failure allowed bears to push the price lower, with DOT dropping below the $5.00 mark to establish support around $4.55.

Polkadot Faces Resistance at $4.55 As Sellers Pressure Prices

Recent Polkadot price analysis shows DOT undergoing a bearish reversal over the last 24 hours. DOT/USD is presently trading at $4.49, down 0.23% from $4.51 at the start of the day.

The Polkadot price action is now capped by immediate resistance at $4.55. Bulls have tried to break above this level in recent days but without success. This paved the way for bearish momentum to dominate and drive the price below $5.00, where DOT found support around $4.55.

Polkadot Drops Below $4.50 As Bulls Struggle At Resistance

August 19 price analysis reveals Polkadot’s DOT token has experienced a bearish reversal in the past day. DOT/USD is currently exchanging hands at $4.49, 0.23% lower than yesterday’s open of $4.51.

DOT is now facing immediate resistance at $4.55 – a level tested multiple times recently but bulls have been unable to surmount. Bears capitalized on this weakness to sink the price below $5.00, with Polkadot establishing support around $4.55 for now.

Polkadot Price History

Analyzing Polkadot’s price action over the past few years reveals significant bullish momentum since early 2021. After trading in a range between $4-$5 for much of the second half of 2020, DOT finally broke out above its previous all-time high of $7 on December 29.

This sparked a strong rally that swiftly carried the Polkadot price towards the $10 projection target. The upside move showcased DOT’s strengthening uptrend in motion.

DOT Price Surges Higher Since 2021 After Period of Consolidation

Looking at Polkadot’s price history shows its strong performance in 2021 comes after a period of consolidation. DOT traded sideways between $4-$5 for much of the latter half of 2020, unable to break out.

But on December 29, DOT finally cracked its old all-time high of $7. This catalyzed a powerful uptrend, sending the Polkadot price surging towards the $10 level in quick fashion. The rally reflects the bullish momentum building behind DOT.

Polkadot Gains Momentum in 2021 After Trading in $4-$5 Range

Analyzing the Polkadot price chart over recent years reveals DOT has been building momentum since 2021 after a period of muted trading. The asset traded in a range between $4-$5 for the second half of 2020, unable to break out.

But on December 29, Polkadot finally managed to crack the previous all-time high of $7. This sparked a rally that quickly took the DOT price towards the projected target of $10, showcasing the growing bullish strength behind the asset.

https://coinmarketcap.com/currencies/polkadot-new/

Polkadot Price Prediction

https://www.cryptopolitan.com/

LATEST POSTS

Advertisement

Shiba Inu Price Forecast: Can SHIB Break Out of Slump and Surge Ahead?

0
Shiba Inu Price Forecast: Can SHIB Break Out of Slump and Surge Ahead?

Shiba Inu Price Stuck Below Key Level As Bears Maintain Control

The live Shiba Inu price today is $0.000008474, down 0.71% in the last 24 hours with a trading volume of $252.31 million. Shiba Inu is currently ranked #14 by market cap at $4.99 billion.

Shiba Inu price analysis

SHIB remains in a bearish trend according to recent price analysis, as the meme coin continues to drop from the key $0.0000100 level lost earlier this week. SHIB has since found support at $0.000008300 but bulls have struggled to push above resistance at $0.000008686.

This ongoing bearish momentum is driven by profit-taking and overall negative sentiment in the wider crypto market. For Shiba Inu to reverse course, buyers will need to force a breakout above $0.000008686. Until then, downside pressure is likely to persist.

With SHIB stuck below its recent highs, technical analysts expect the downtrend to continue in the near-term. The meme coin is vulnerable to further losses if support at $0.000008300 fails to hold.

To turn bullish again, SHIB needs to see significant buyer volumes come in and reclaim $0.000008768 and higher. Otherwise, bears look poised to push the price towards $0.000008000 and potentially lower support levels if selling pressure intensifies.

Shiba Inu Price History

www.cryptopolitan.com

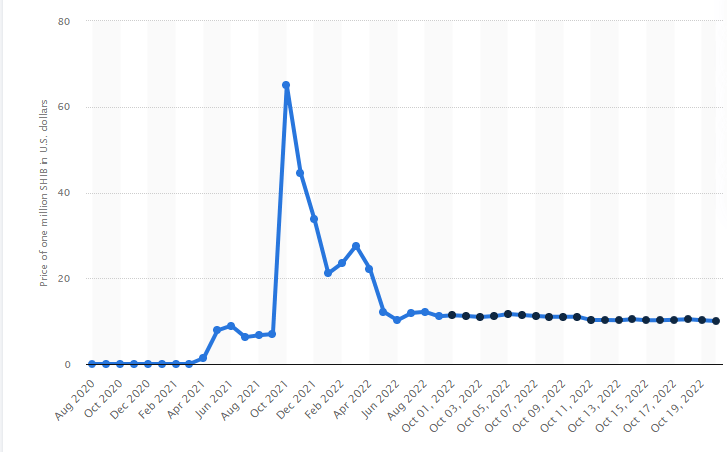
The price of Shiba Inu coin grew by 300% in October 2021. This was similar to how popular Dogecoin had become earlier that year.

Shiba Inu briefly became one of the biggest cryptocurrencies based on daily trading volume. At its peak, it was close to Ethereum’s trading levels.

Shiba Inu coin started as a fun token based on the dog breed. But it became popular last fall because of its very low price and easy accessibility. Even after the 300% surge, it was still one of the cheapest coins available.

The meme appeal and low price likely attracted many new crypto investors seeking quick profits. Surveys show people often buy crypto for money or fun. For them, Shiba Inu was an inexpensive, entertaining investment during its viral hype.

This shows the power of memes and consumer psychology in crypto prices. Shiba Inu demonstrated meme coins can gain value instantly from internet buzz – in a way most assets can’t match. Its 300% rally was fueled by turning viral popularity into real blockchain activity.

Shiba Inu Price Predictions 2023-2032

www.cryptopolitan.com

LATEST POSTS

Advertisement

Bitcoin Falls Further, Analyst Predicts More Losses Ahead

0
Bitcoin Falls Further, Analyst Predicts More Losses Ahead

Veteran cryptocurrency analyst Benjamin Cowen has cautioned that Bitcoin could continue falling after its recent 15% decline from last month’s peak.

Cowen believes the latest crypto market downturn aligns with a 4-year cycle pattern tied to Bitcoin’s halving schedule. He points to the concept of “secondary fear” – where the S&P 500 typically drops in August/September of pre-election years.

The S&P 500 index has already fallen over 5% since early August. Cowen notes that during past secondary fear periods, Bitcoin has plunged between 39% and 83%. In 2019, a bearish candle pushed Bitcoin below its 20-week moving average, sparking a 61% decline. The 2015 and 2011 drops were around 40% and 80% respectively.

According to Cowen’s analysis, if history repeats, Bitcoin could find a bottom around $17,500 – a 40% drop from current levels. A 61% decline similar to 2019 would sink Bitcoin to $11,400. While an 80% crash can’t be ruled out, Cowen thinks that’s unlikely this cycle.

The veteran analyst believes Bitcoin is still susceptible to further downside as the crypto market enters the latter stages of its 4-year halving cycle. Investors should brace for heightened volatility and more potential drawdowns in the coming weeks and months. Past secondary fear cycles indicate Bitcoin may not find a definitive bottom until Q4 2022 or Q1 2023.

LATEST POSTS

Advertisement

Liquidations Cause XRP to Suddenly Crash 45% on Bybit Exchange

0
Liquidations Cause XRP to Suddenly Crash 45% on Bybit Exchange

Over the last 24 hours, the price of XRP has fallen by more than 15%. This decline was made worse by a huge 45% price crash on the Bybit exchange early today.

According to a well-known Bybit user, this crash likely happened because there was a big difference between two XRP contract prices on Bybit. Many traders were forced to sell their XRP positions all at once. This created a domino effect that crashed the price 45%.

The massive sell-off came after news that Ripple opposed the SEC’s attempt to appeal a court ruling finding XRP not a security.

The overall crypto market downturn, with Bitcoin falling below $25,000, also drove panic selling of XRP. Over $50 million in leveraged XRP trades were liquidated on Bybit, fueling the flash crash.

LATEST POSTS

Advertisement

Bitcoin Sinks to $25K While Altcoins Plummet Further

0
Bitcoin Sinks to $25K While Altcoins Plummet Further

Bitcoin Plummets to $25K as Altcoins See Even Deeper Losses

Bitcoin‘s nosedive continued over the past 24 hours with a flash crash on several exchanges that pushed it down to $25,300, a new two-month low. However, many altcoins dropped even more precipitously than BTC. Aside from XRP, some of the biggest losers were LTC, BCH, and XLM.

BTC Takes a Hard Hit

Just on Monday, Bitcoin had spiked up to $29,700, reaching a multi-day high. More positive news followed Tuesday with the listing of Europe’s first spot Bitcoin ETF on Euronext Amsterdam. However, BTC ETFs often lead to sell-offs, and instead of climbing higher, Bitcoin started rapidly losing ground. By Thursday, it had already fallen below $29,000.

Over the past 24 hours, things got even worse with Bitcoin plummeting to $25,300 on exchanges like Coinbase, marking a new two-month low. Despite bouncing back over $1,000 since then, BTC remains down over 7% on the day. Its market cap, once above $570 billion, is now struggling below $515 billion. Its dominance over altcoins has also declined to 48.4%.

XRP Leads the Altcoin Declines

As typically happens during big BTC crashes, altcoins are hit equally hard, if not worse. Ethereum has slumped 6% and is trading under $1,700 after being over $1,850 just days ago.

Other major altcoins like BNB, ADA, SOL, DOGE, DOT, MATIC, and SHIB have fallen similarly. Even steeper losses are seen in XRP, LTC, and BCH, all down double-digits.

XRP’s 15% drop has pushed it down to $0.5. Most lower- and mid-cap altcoins are down between 5-10% as well. Overall, the crypto market cap has plummeted by $70 billion in the last day to $1.06 trillion, declining over $100 billion since Tuesday.

LATEST POSTS

Advertisement

NFT Market Updates

0
NFT Market Updates
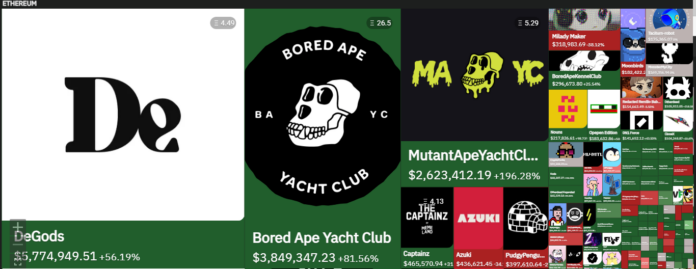
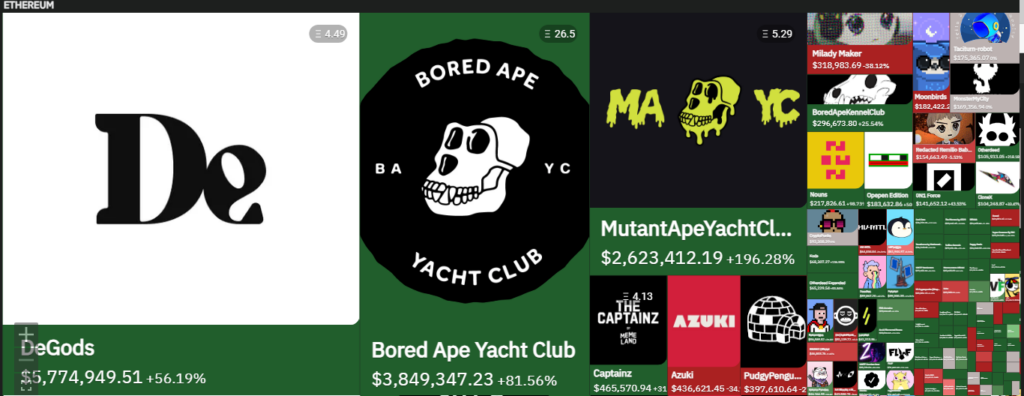
Changes in Top Collections by Volume:
Bored Ape Yacht Club: $14,989,075 (-43.65%)
 Mutant Ape Yacht Club: $9,189,839 (-3.07%)
DeGods: $3,640,111 (-41.75%)
CryptoPunks: $3,190,798 (0.00%)
BoredApeKennelClub: $2,861,537 (+44.72%)
Advertisement

Coinbase Stops Trading Tether (USDT), RAI, and DAI for Users in Canada

0
Coinbase Stops Trading Tether (USDT), RAI, and DAI for Users in Canada

Coinbase announced it will stop allowing trading of three major stablecoins – Tether (USDT), RAI, and DAI – for its users in Canada. This starts on August 31st. Coinbase made this decision shortly after fully launching in Canada and offering support for the top stablecoin, Tether (USDT).

According to an email to customers, Coinbase said these three assets do not meet their listing standards anymore based on recent reviews. But users can still deposit and withdraw the stablecoins after trading stops.

Coinbase’s move is similar to Crypto.com, which stopped Canadian USDT services in January due to instructions from regulators. Last December, Canadian regulators said major stablecoins like USDT are securities. They said crypto exchanges cannot let Canadians trade assets that are securities. It seems Coinbase is responding to similar regulatory pressure by removing USDT support. However, its own stablecoin USDC will still be tradable in Canada.

Stablecoins are pegged to real assets like the US dollar to maintain a steady value. They are important for crypto markets and decentralized finance (DeFi). Tether (USDT) is the largest stablecoin but has faced questions about its dollar reserves and audits.

Earlier this week, Coinbase highlighted its full launch in Canada after previously offering limited trading. This followed a “regulation by engagement” approach, not “regulation by enforcement.”

Meanwhile, top exchange Binance stopped Canadian operations in June due to unclear stablecoin guidance. Coinbase’s move signals regulators may be cracking down more on tokenized dollars.

LATEST POSTS

Advertisement

Tether Stops Support for USDT on Omni, SLP, and Kusama Due to Low Use

0
Tether Stops Support for USDT on Omni, SLP, and Kusama Due to Low Use

Tether recently announced it will stop supporting its USDT stablecoin on three blockchains: Omni, Simple Ledger Protocol (SLP), and Kusama. Tether said there is not enough adoption of USDT on these blockchains.

This shows the ongoing challenges Bitcoin has with being a platform for stablecoins and decentralized apps.

Omni Does Not Gain Traction Despite Early Tether Support

Tether decides which networks to support based on community interest and usage numbers. For Omni, Tether said there are not enough popular tokens and USDT is available on other blockchains.

Omni was the first platform Tether used for USDT in 2014. But over time, crypto exchanges and users preferred Ethereum, Tron and others over Omni for stablecoin transactions.

Tether would think about supporting USDT on Omni again if use of its decentralized exchange and token features increased a lot. But for now, Omni does not have the adoption needed to maintain USDT.

Unclear If Bitcoin Will Support Stablecoins and Decentralized Apps

While Tether stops Omni support, it still plans to offer USDT on RGB. This is a new Bitcoin smart contract system using the base layer and Lightning Network. Tether hopes RGB will “open a new era for digital assets, smart contracts, and digital rights.”

Omni’s struggles show limitations Bitcoin currently has for advanced smart contracts needed for stablecoins and decentralized apps. But developers are working on solutions like RGB and a recent stablecoin launched on Bitcoin’s base layer.

So while Tether ends USDT on Omni, it’s still unclear if Bitcoin will support stablecoins and decentralized apps in the future. But more adoption may be needed for Bitcoin to compete with platforms like Ethereum in this area.

LATEST NEWS

Advertisement

Avalanche (AVAX) Faces Crucial Support Test As Prices Slide Lower

0
Avalanche (AVAX) Faces Crucial Support Test As Prices Slide Lower

Avalanche (AVAX) is facing a critical test of support around the $11.50 level, which has held for over two years. A decisive breakdown of this long-standing floor could open the doors for substantial losses.

According to technical analysts, if the $11.50 support gives way, the next major level sits around $6. That would represent a nearly 50% decline from the current price.

AVAX has struggled to rebound despite bouncing twice off the $11.50 support in 2022. The price remains stuck below descending resistance around $20.

With the weekly and daily RSI in downtrends below 50, momentum indicates further downside risk. Bulls need to show commitment soon to defend the multi-year support.

Avalanche Slides Below Crucial Resistance After All-Time High

Since hitting its record peak of $147 in November 2021, AVAX has plunged below declining resistance currently around $20. This descending trendline has rejected rallies as recently as March 2022. During the decline, the price bounced twice at the horizontal support level of $11.50 in January and June 2023.

Despite bullish catalysts like Uniswap V3 on Avalanche, AVAX is struggling below resistance. On pullbacks, AVAX found buying interest twice near $11.50 support in 2022. However, upside remains elusive.

AVAX is fighting to hold the multi-year horizontal floor at $11.50 amid bearish momentum. Weekly and daily RSI below 50 signals building downside pressure as buyers fail to gain traction. A decisive breakdown of the long-standing $11.50 level opens the door for a potential 50% crash from here according to analysts.

Forecasting Future Movement for Avalanche’s AVAX Token

The RSI below 50 shows waning momentum as bulls lose control. Both weekly and daily timeframes signal growing downside risk. Rejection at $14.50 resistance preceded the recent slide, while the breakdown from short-term descending resistance looks invalidated.

With AVAX back below the breakout level, technicals suggest the rally failed to sustain upside momentum. Oversold RSI conditions likely sparked bounces earlier this year, but buyers have struggled to make progress since.

The loss of the crucial long-term floor at $11.50 exposes AVAX to a potential 50% collapse toward the next major support zone around $6. Given bearish technical signals across timeframes, the path of least resistance appears lower for AVAX without a swift reclaim of key levels.

LATEST POSTS

Advertisement