- BTCD has bounced at the 42.60% support area.
- Technical indicators are undecided.
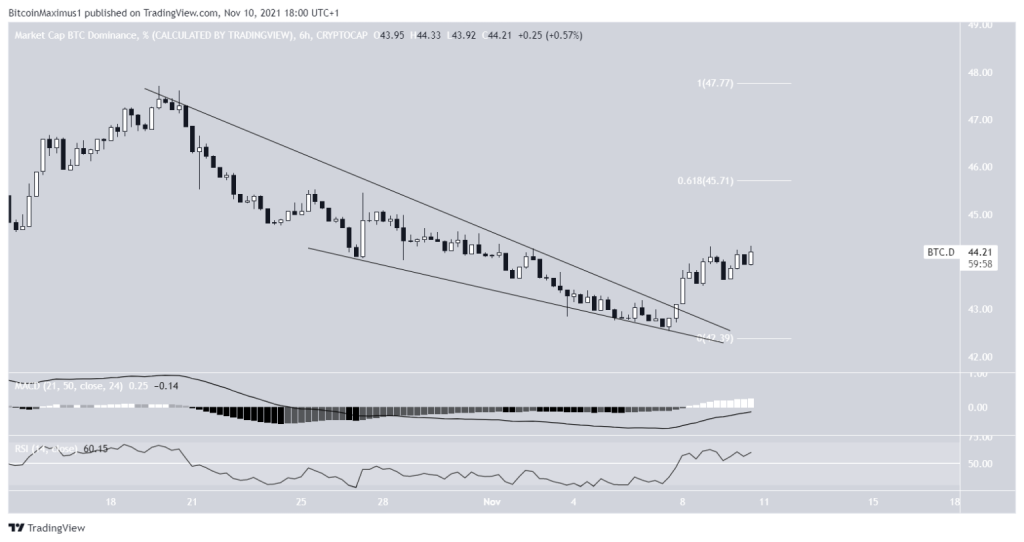
- BTCD has broken out from a short-term descending wedge.
The Bitcoin Dominance Rate (BTCD) has been increasing over the past five days and is approaching a crucial resistance area, a breakout above which could determine the direction of the future trend.
BTCD has been moving downwards since it reached a high of 47.72% on Oct 20. The downward movement culminated with a low of 42.37% on Nov 6.
However, it bounced afterwards and has been increasing since. The bounce was crucial since it served to validate the 42.6% area as support. This is the 0.618 Fib retracement support level and a horizontal support area.
Technical indicators are at a make-or-break level.
The RSI, which is a momentum indicator, is right at the 50 line. Movements above and below this line can be used as determinants for the direction of the trend.
Similarly, the MACD has begun to move upwards, and is close to the 0 line. The MACD is created by a short- and a long-term moving average (MA), and a movement above the 0 line means that the short-term MA is faster than the long-term one.
Finally, the Supertrend, which uses volatility to determine the direction of the trend is bearish. The indicator line is at 45.7%. This is also the 0.618 Fib retracement resistance level, making it a pivotal resistance area.
Therefore, whether BTCD manages to break out above this resistance will be crucial in determining the direction of the future trend.

Future BTCD movement
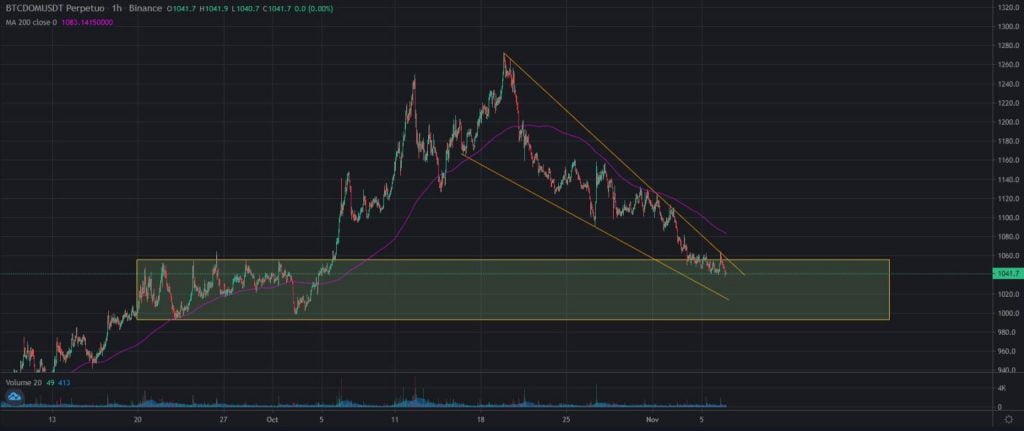
Cryptocurrency trader @KoschLions outlined a BTCD chart, stating that it is likely to break out from its descending wedge soon.

Since the tweet, BTCD has already broken out from the wedge and is in the process of moving upwards towards the previously outlined 45.70% resistance area.
The MACD and RSI are both moving upwards, supporting the continuation of the upward movement.
Therefore, BTCD is likely to get to the resistance area, but it is still undetermined whether it will break out.


