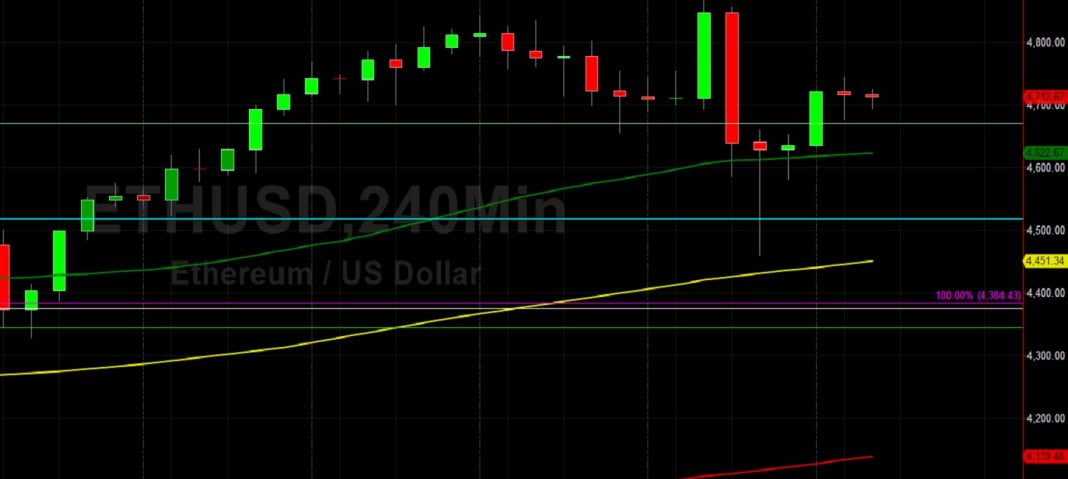
Ethereum (ETH/USD) looked for fresh technical sentiment early in the Asian session as the pair continued to orbit some technically significant areas after trading at a new all-time high around the 4867.81 level earlier in the week. Selling pressure drove ETH/USD lower to the 4460 area, representing a test of the 76.4% retracement of the appreciating range from 4329.21 to 4867.81. Stops were elected below the 4740, 4662, 4598, and 4534 areas during the sharp pullback after the new all-time high was reached.
Additional upside price objectives include the 4895.12, 5035.94, 5060.87, and 5268.46 areas. Following the recent appreciation, downside price retracement levels and areas of potential technical support include the 4344, 4253, 4114, 4093, and 4020 levels. Traders are observing that the 50-bar MA (4-hourly) is bullishly indicating above the 100-bar MA (4-hourly) and above the 200-bar MA (4-hourly). Also, the 50-bar MA (hourly) is bullishly indicating above the 100-bar MA (hourly) and above the 200-bar MA (hourly).
Price activity is nearest the 50-bar MA (4-hourly) at 4622.70 and the 50-bar MA (Hourly) at 4725.14.
Technical Support is expected around 3515.25/ 3375.24/ 3235.23 with Stops expected below.
Technical Resistance is expected around 4895.12/ 5035.94/ 5060.87 with Stops expected above.
On 4-Hourly chart, SlowK is Bullishly above SlowD while MACD is Bearishly below MACDAverage.
On 60-minute chart, SlowK is Bearishly below SlowD while MACD is Bullishly above MACDAverage.


